


| Duration | 0:00 | Takeoff Distance | 0 |
| Height: | metres |
| Climb: | m/sec |
| Speed: | km/h |
| Distance: | km |
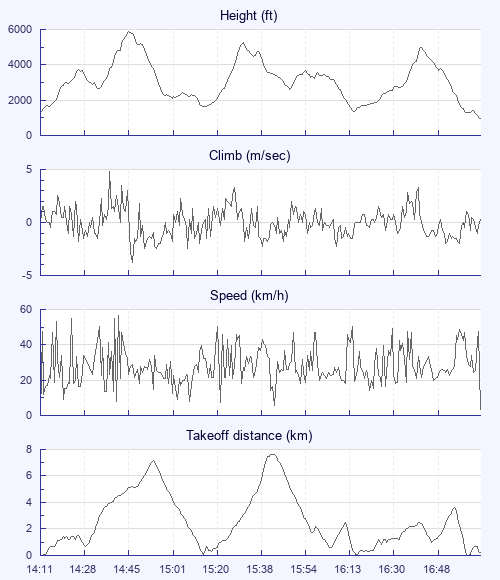
| Height - GPS data | |
| Maximum Height [14:46:19] |
5899 ft |
| Lowest Save [16:17:00] |
1381 ft |
| Takeoff Height [14:11:18] |
1325 ft |
| Landing Height [17:08:26] |
981 ft |
| Total Ascent | 19498 ft |
| Height Gain | |
| Above Takeoff | 4573 ft |
| Maximum | 4577 ft |
| Low Point [14:11:22] |
1322 ft |
| High Point as Maximum Height |
5899 ft |
| Units | |
| Climb - Pressure data | |
| Maximum Climb [14:39:46] |
4.8 m/s |
| Minimum Climb [14:46:38] |
-3.8 m/s |
| Units | |
| Speed | |
| Maximum Speed [14:42:22] |
56.7 km/h |
| Average Speed around course |
11.3 km/h |
| Average Speed over track length |
27.9 km/h |
| Units | |
| Tracklog | |
| Flight Duration | 2hrs 57mins |
| Track Points | 10629 |
| Recording Interval | 1 secs |
| Statistics Interval | 4 secs |
| Track Length | 82.5 km |
| Units | |
| Flight instrument | |
| Type | Flymaster |
| Model | Livesd |
| Firmware | 2.03b |
| Height: | |
| Speed: | |
| Climb: | |
| Distance: |
| Main Map: |
| First Tab: |