Xc Title
User:Guest
Ozone advert
Brian Stewart  All flights
National League 2019
Flight type image
Turnpoint Flight on a Paraglider
Club
Pennine
Glider
Advance Sigma 10
Date
22nd May 2019
Start
11:46
Finish
13:47
Duration
2hrs
Takeoff
Parlick
Landing
Nr Skipton
Coords
Takeoff
53.89983, -2.61908
Start
53.89878, -2.62112
TP1
53.91787, -2.64432
TP2
53.90875, -2.61570
TP3
53.89677, -2.63393
Finish
53.95507, -2.02705
Landing
53.95420, -2.02863
Distances and Score
Leg 1
2.62k
Leg 2
2.14k
Leg 3
1.79k
Leg 4
40.39k
Total
46.94k
Score
46.9
Open Distance
Total
40.8k
Filename
Use full pilot name
Download
Validated
Yes
Flight map
Notes

This map gives an overview of the flight, using the turnpoints to plot the track.

Use the for a detailed map and flight track.

Duration 0:00   Takeoff Distance 0
Controls
To animate the flight: click a point on the track, use the slider, or click the Play button.
slider
slider
Speed
Speed
Slower
Faster
Track color
No data
Highlights
Track data
Time: No data
Height:
Climb:
Speed:
Interval:
Units
Height: metres
Climb: m/sec
Speed: km/h
Distance: km
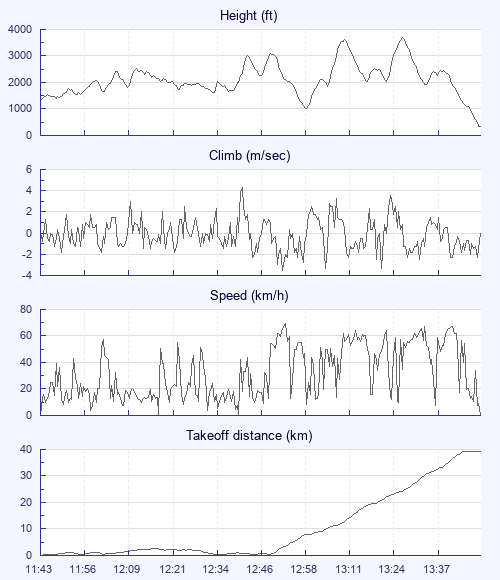
chart
Notes

Climb and Speed averaged over 4 second intervals.

These values may be lower than those shown by a flight instrument, which has access to continuous raw data.

Metric units are used for all chart data, except for Height which is shown in feet.

Height   -   GPS data
Maximum Height
[13:28:51]
3681 ft
Lowest Save
[12:59:42]
1030 ft
Takeoff Height
[11:43:18]
1316 ft
Landing Height
[13:50:38]
335 ft
Total Ascent 14193 ft
Height Gain
Above Takeoff 2365 ft
Maximum 2651 ft
Low Point
as Lowest Save
1030 ft
High Point
as Maximum Height
3681 ft
Units
Climb   -   Pressure data
Maximum Climb
[12:42:09]
4.3 m/s
Minimum Climb
[12:53:33]
-3.5 m/s
Units
Speed
Maximum Speed
[12:53:53]
69.3 km/h
Average Speed
around course
23.4 km/h
Average Speed
over track length
32.8 km/h
Units
Tracklog
Flight Duration 2hrs 7mins
Track Points 7634
Recording Interval 1 secs
Statistics Interval 4 secs
Track Length 69.6 km
Units
Flight instrument
Type Xc_tracer_ii
Model Not Set
Firmware Xc_tracer_ii_r09
Notes

Climb and Speed averaged over 4 second intervals.

These values may be lower than those shown by a flight instrument, which has access to continuous raw data.

Average Speed around course is measured from Start to Finish points.

Track Length is the cumulative distance between track points from Takeoff to Landing.

You can change the default units displayed - see the Options page.

Yet another unexpected flight. Most forecasts said 'blown out' but I found one I liked better, and went with that. The presence of Chris F on the hill was encouraging - maybe I'd got it right after all. First hour was spent bimbling around the west bowl in snotty unpleasant air, and gradually the others went down, clearly not having much fun. I stuck around, and prompted by the offer of a retrieve and finding a strong organised climb from the SW spur, went on a downwind dash to Dunsop Bridge, the Parlick milk run.

Chris also found a climb and headed over the high ground while I opted for the valley as base was barely 3000'. Past the Inn at Whitewell, landing gear down, thoughts of an early pint at the pub, I squeaked over a little pimple that ticked all the textbook thermal trigger boxes. It was rough at first but soon organised into a decent climb up to a great-looking cloud street. Once there, the lift was consistent and easy to follow. Only trouble was it was pointing straight towards Skipton and Leeds Bradford airspace. I made a couple of attempts to track north, but there was nothing but blue. 60 min after leaving Parlick, I was 40km downwind at Skipton - a bigger distance was on but there's not much room to sneak under the airspace over the high ground beyond the town. Oh well, a nice day out, super big paying field to land in (vertically! ), a cold beer and a bus pass ride back to Clitheroe where JohnO picked me up.

Use this page to set various display Options. You can choose which units are used to display flight data, which map to show when the starts and which tab to show each time you view a flight.
Units settings

Metric units are used by default for the Statistics and XC Player pages, except for Height data which is shown in feet. You can choose your own custom settings here.

Height:
Speed:
Climb:
Distance:
  Use default
XC Player settings

When the XC Player starts, the track data is shown on the Hybrid map. You can choose a different map here.

Main Map:
  Use default
Tab settings

The first tab shown when you view a flight is the Flight Map. You can choose a different tab here.

First Tab:
  Use default
Notes

This page uses cookies to save your settings for future visits.

If you have disabled cookies for this site then any changes you make will not be saved.