Xc Title
User:Guest
Naviter advert
Stephen Pym  All flights
National League 2019
Flight type image
Turnpoint Flight on a Paraglider
Club
Long Mynd
Glider
Ozone Zeno
Date
2nd July 2019
Start
14:19
Finish
18:07
Duration
3hrs 48mins
Takeoff
Lawley
Landing
Hardwicke
Coords
Takeoff
52.57927, -2.74097
Start
52.57000, -2.75020
TP1
52.59052, -2.77243
TP2
52.12030, -2.30768
TP3
51.84228, -2.32865
Finish
51.80962, -2.27825
Landing
51.81095, -2.27863
Distances and Score
Leg 1
2.74k
Leg 2
61.16k
Leg 3
30.97k
Leg 4
5.03k
Total
99.90k
Score
99.9
Open Distance
Total
93.2k
Filename
Use full pilot name
Download
Validated
Yes
Flight map
Notes

This map gives an overview of the flight, using the turnpoints to plot the track.

Use the for a detailed map and flight track.

Duration 0:00   Takeoff Distance 0
Controls
To animate the flight: click a point on the track, use the slider, or click the Play button.
slider
slider
Speed
Speed
Slower
Faster
Track color
No data
Highlights
Track data
Time: No data
Height:
Climb:
Speed:
Interval:
Units
Height: metres
Climb: m/sec
Speed: km/h
Distance: km
chart
Notes

Climb and Speed averaged over 4 second intervals.

These values may be lower than those shown by a flight instrument, which has access to continuous raw data.

Metric units are used for all chart data, except for Height which is shown in feet.

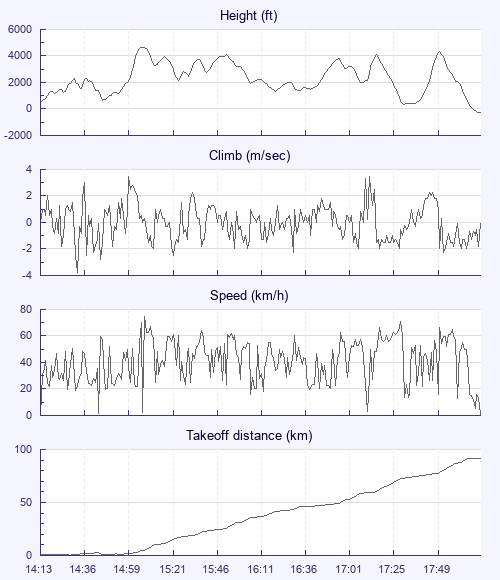
Height   -   Pressure data
Maximum Height
[15:05:51]
4672 ft
Lowest Save
[17:31:03]
364 ft
Takeoff Height
[14:13:50]
522 ft
Landing Height
[18:08:57]
-282 ft
Total Ascent 24170 ft
Height Gain
Above Takeoff 4150 ft
Maximum 4160 ft
Low Point
[14:13:53]
512 ft
High Point
as Maximum Height
4672 ft
Units
Climb   -   Pressure data
Maximum Climb
[14:59:02]
3.5 m/s
Minimum Climb
[14:32:54]
-3.8 m/s
Units
Speed
Maximum Speed
[15:06:26]
74.7 km/h
Average Speed
around course
26.2 km/h
Average Speed
over track length
42.1 km/h
Units
Tracklog
Flight Duration 3hrs 55mins
Track Points 14108
Recording Interval 1 secs
Statistics Interval 4 secs
Track Length 165.0 km
Units
Flight instrument
Type Oudie 4
Model Not Set
Firmware 9.13.001
Notes

Climb and Speed averaged over 4 second intervals.

These values may be lower than those shown by a flight instrument, which has access to continuous raw data.

Average Speed around course is measured from Start to Finish points.

Track Length is the cumulative distance between track points from Takeoff to Landing.

You can change the default units displayed - see the Options page.

Use this page to set various display Options. You can choose which units are used to display flight data, which map to show when the starts and which tab to show each time you view a flight.
Units settings

Metric units are used by default for the Statistics and XC Player pages, except for Height data which is shown in feet. You can choose your own custom settings here.

Height:
Speed:
Climb:
Distance:
  Use default
XC Player settings

When the XC Player starts, the track data is shown on the Hybrid map. You can choose a different map here.

Main Map:
  Use default
Tab settings

The first tab shown when you view a flight is the Flight Map. You can choose a different tab here.

First Tab:
  Use default
Notes

This page uses cookies to save your settings for future visits.

If you have disabled cookies for this site then any changes you make will not be saved.