


| Duration | 0:00 | Takeoff Distance | 0 |
| Height: | metres |
| Climb: | m/sec |
| Speed: | km/h |
| Distance: | km |
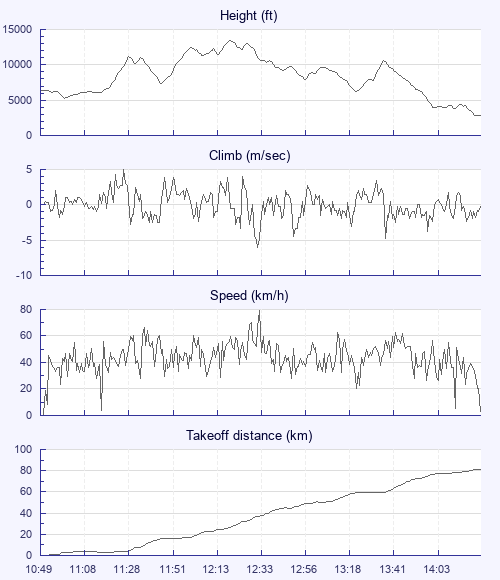
| Height - GPS data | |
| Maximum Height [12:19:46] |
13455 ft |
| Lowest Save [14:11:47] |
3799 ft |
| Takeoff Height [10:49:46] |
6348 ft |
| Landing Height [14:21:58] |
2779 ft |
| Total Ascent | 31325 ft |
| Height Gain | |
| Above Takeoff | 7106 ft |
| Maximum | 8182 ft |
| Low Point [10:59:09] |
5272 ft |
| High Point as Maximum Height |
13455 ft |
| Units | |
| Climb - Pressure data | |
| Maximum Climb [11:26:18] |
5.0 m/s |
| Minimum Climb [12:33:10] |
-6.0 m/s |
| Units | |
| Speed | |
| Maximum Speed [12:33:26] |
79.2 km/h |
| Average Speed around course |
24.1 km/h |
| Average Speed over track length |
44.0 km/h |
| Units | |
| Tracklog | |
| Flight Duration | 3hrs 32mins |
| Track Points | 12733 |
| Recording Interval | 1 secs |
| Statistics Interval | 4 secs |
| Track Length | 155.5 km |
| Units | |
| Flight instrument | |
| Type | Oudie 4 |
| Model | Not Set |
| Firmware | 9.13.001 |
| Height: | |
| Speed: | |
| Climb: | |
| Distance: |
| Main Map: |
| First Tab: |