


| Duration | 0:00 | Takeoff Distance | 0 |
| Height: | metres |
| Climb: | m/sec |
| Speed: | km/h |
| Distance: | km |
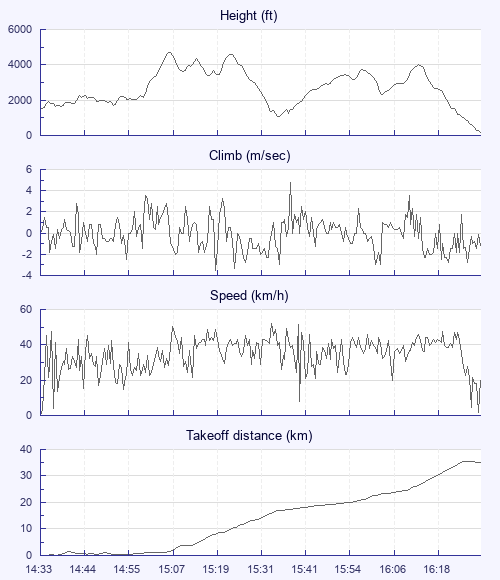
| Height - GPS data | |
| Maximum Height [15:07:35] |
4718 ft |
| Lowest Save [15:37:05] |
1050 ft |
| Takeoff Height [14:33:33] |
1512 ft |
| Landing Height [16:31:24] |
151 ft |
| Total Ascent | 14731 ft |
| Height Gain | |
| Above Takeoff | 3205 ft |
| Units | |
| Climb - Pressure data | |
| Maximum Climb [15:40:05] |
4.8 m/s |
| Minimum Climb [15:20:13] |
-3.5 m/s |
| Units | |
| Speed | |
| Maximum Speed [15:35:41] |
52.2 km/h |
| Average Speed around course |
21.4 km/h |
| Average Speed over track length |
34.5 km/h |
| Units | |
| Tracklog | |
| Flight Duration | 1hr 57mins |
| Track Points | 7072 |
| Recording Interval | 1 secs |
| Statistics Interval | 4 secs |
| Track Length | 67.7 km |
| Units | |
| Flight instrument | |
| Type | Oudie 4 |
| Model | Not Set |
| Firmware | 9.14.001 |
| Height: | |
| Speed: | |
| Climb: | |
| Distance: |
| Main Map: |
| First Tab: |