


| Duration | 0:00 | Takeoff Distance | 0 |
| Height: | metres |
| Climb: | m/sec |
| Speed: | km/h |
| Distance: | km |
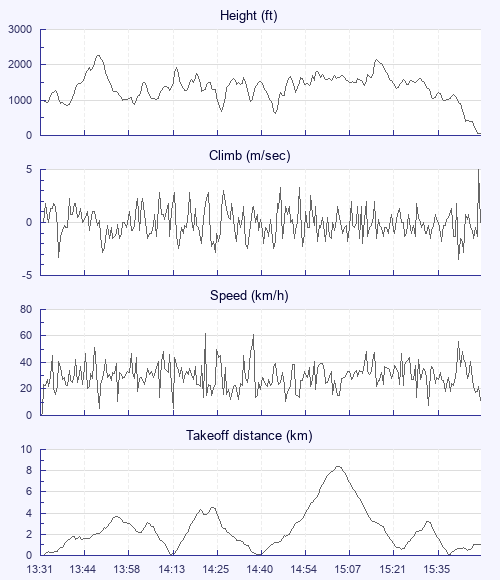
| Height - GPS data | |
| Maximum Height [13:49:40] |
2270 ft |
| Lowest Save [14:45:38] |
633 ft |
| Takeoff Height [13:31:13] |
997 ft |
| Landing Height [15:50:02] |
43 ft |
| Total Ascent | 14190 ft |
| Height Gain | |
| Above Takeoff | 1273 ft |
| Maximum | 1572 ft |
| Low Point as Lowest Save |
633 ft |
| High Point [15:16:54] |
2205 ft |
| Units | |
| Climb - GPS data | |
| Maximum Climb [15:49:57] |
5.0 m/s |
| Minimum Climb [15:43:41] |
-3.5 m/s |
| Units | |
| Speed | |
| Maximum Speed [14:23:46] |
62.1 km/h |
| Average Speed around course |
17.6 km/h |
| Average Speed over track length |
30.0 km/h |
| Units | |
| Tracklog | |
| Flight Duration | 2hrs 18mins |
| Track Points | 4980 |
| Recording Interval | 2 secs |
| Statistics Interval | 4 secs |
| Track Length | 69.3 km |
| Units | |
| Flight instrument | |
| Type | Flyskyhy |
| Model | 6.13 |
| Firmware | 6.13 |
| Height: | |
| Speed: | |
| Climb: | |
| Distance: |
| Main Map: |
| First Tab: |