


| Duration | 0:00 | Takeoff Distance | 0 |
| Height: | metres |
| Climb: | m/sec |
| Speed: | km/h |
| Distance: | km |
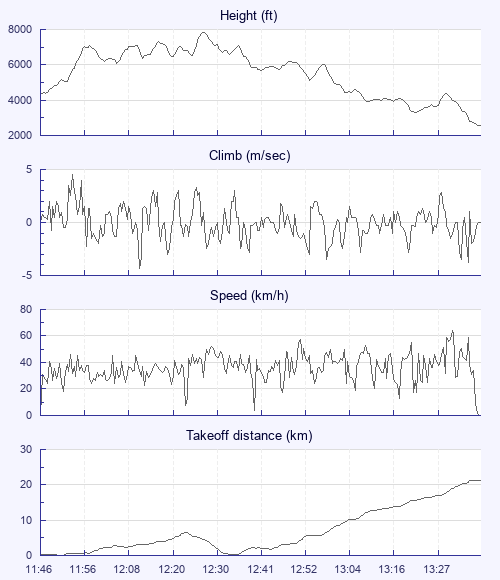
| Height - GPS data | |
| Maximum Height [12:27:00] |
7838 ft |
| Lowest Save [13:21:36] |
3307 ft |
| Takeoff Height [11:46:06] |
4403 ft |
| Landing Height [13:36:21] |
2566 ft |
| Total Ascent | 12451 ft |
| Height Gain | |
| Above Takeoff | 3435 ft |
| Maximum | 3465 ft |
| Low Point [11:46:23] |
4373 ft |
| High Point as Maximum Height |
7838 ft |
| Units | |
| Climb - GPS data | |
| Maximum Climb [11:53:54] |
4.5 m/s |
| Minimum Climb [12:11:18] |
-4.3 m/s |
| Units | |
| Speed | |
| Maximum Speed [13:31:02] |
63.9 km/h |
| Average Speed around course |
20.1 km/h |
| Average Speed over track length |
36.4 km/h |
| Units | |
| Tracklog | |
| Flight Duration | 1hr 50mins |
| Track Points | 6616 |
| Recording Interval | 1 secs |
| Statistics Interval | 4 secs |
| Track Length | 66.9 km |
| Units | |
| Flight instrument | |
| Type | Samsung Sm-j320fn 5.1.1 |
| Model | Not Set |
| Firmware | 0.8.2 |
| Height: | |
| Speed: | |
| Climb: | |
| Distance: |
| Main Map: |
| First Tab: |