


| Duration | 0:00 | Takeoff Distance | 0 |
| Height: | metres |
| Climb: | m/sec |
| Speed: | km/h |
| Distance: | km |
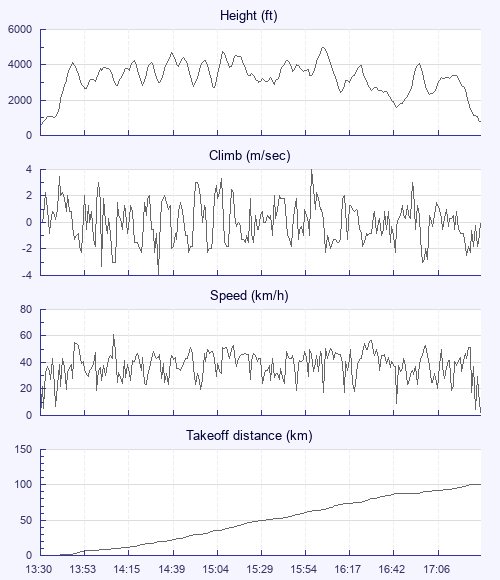
| Height - GPS data | |
| Maximum Height [16:08:32] |
4964 ft |
| Lowest Save [16:50:23] |
1604 ft |
| Takeoff Height [13:30:08] |
574 ft |
| Landing Height [17:33:18] |
814 ft |
| Total Ascent | 29534 ft |
| Height Gain | |
| Above Takeoff | 4390 ft |
| Units | |
| Climb - Pressure data | |
| Maximum Climb [16:02:45] |
4.0 m/s |
| Minimum Climb [14:33:52] |
-4.0 m/s |
| Units | |
| Speed | |
| Maximum Speed [14:08:40] |
61.2 km/h |
| Average Speed around course |
26.2 km/h |
| Average Speed over track length |
38.3 km/h |
| Units | |
| Tracklog | |
| Flight Duration | 4hrs 3mins |
| Track Points | 14590 |
| Recording Interval | 1 secs |
| Statistics Interval | 4 secs |
| Track Length | 155.4 km |
| Units | |
| Flight instrument | |
| Type | Oudie 4 |
| Model | Not Set |
| Firmware | 9.15.001 |
| Height: | |
| Speed: | |
| Climb: | |
| Distance: |
| Main Map: |
| First Tab: |