


| Duration | 0:00 | Takeoff Distance | 0 |
| Height: | metres |
| Climb: | m/sec |
| Speed: | km/h |
| Distance: | km |
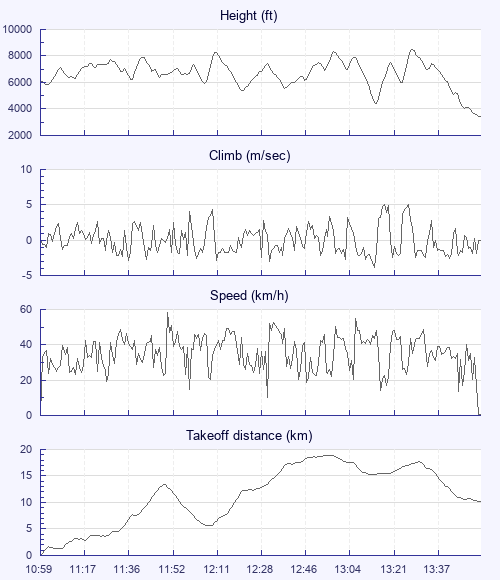
| Height - GPS data | |
| Maximum Height [13:32:02] |
8504 ft |
| Lowest Save [13:18:32] |
4396 ft |
| Takeoff Height [10:59:22] |
6175 ft |
| Landing Height [13:57:52] |
3399 ft |
| Total Ascent | 24629 ft |
| Height Gain | |
| Above Takeoff | 2329 ft |
| Maximum | 4108 ft |
| Low Point as Lowest Save |
4396 ft |
| High Point as Maximum Height |
8504 ft |
| Units | |
| Climb - Pressure data | |
| Maximum Climb [13:21:22] |
5.1 m/s |
| Minimum Climb [13:18:12] |
-3.8 m/s |
| Units | |
| Speed | |
| Maximum Speed [11:52:22] |
58.3 km/h |
| Average Speed around course |
23.2 km/h |
| Average Speed over track length |
34.8 km/h |
| Units | |
| Tracklog | |
| Flight Duration | 2hrs 58mins |
| Track Points | 1072 |
| Recording Interval | 10 secs |
| Statistics Interval | 10 secs |
| Track Length | 103.5 km |
| Units | |
| Flight instrument - reported as | |
| SKYTRAXX V1.69 SN:3328377776 |
| Height: | |
| Speed: | |
| Climb: | |
| Distance: |
| Main Map: |
| First Tab: |