


| Duration | 0:00 | Takeoff Distance | 0 |
| Height: | metres |
| Climb: | m/sec |
| Speed: | km/h |
| Distance: | km |
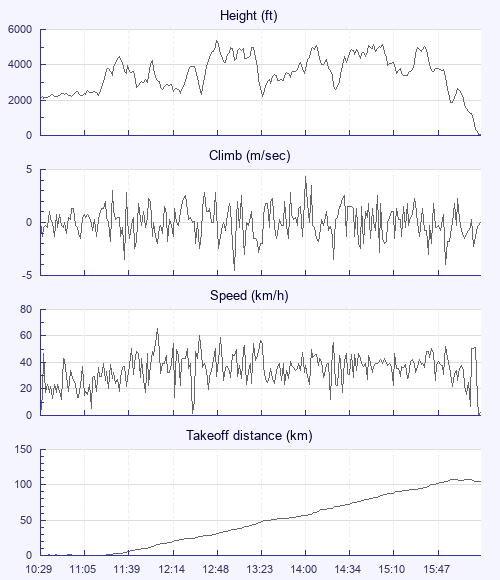
| Height - GPS data | |
| Maximum Height [12:49:25] |
5358 ft |
| Lowest Save [16:01:47] |
1847 ft |
| Takeoff Height [10:29:06] |
2106 ft |
| Landing Height [16:22:08] |
75 ft |
| Total Ascent | 35899 ft |
| Height Gain | |
| Above Takeoff | 3251 ft |
| Maximum | 3281 ft |
| Low Point [10:32:03] |
2077 ft |
| High Point as Maximum Height |
5358 ft |
| Units | |
| Climb - Pressure data | |
| Maximum Climb [14:02:18] |
4.3 m/s |
| Minimum Climb [13:03:06] |
-4.5 m/s |
| Units | |
| Speed | |
| Maximum Speed [12:03:38] |
65.7 km/h |
| Average Speed around course |
22.5 km/h |
| Average Speed over track length |
35.4 km/h |
| Units | |
| Tracklog | |
| Flight Duration | 5hrs 53mins |
| Track Points | 21180 |
| Recording Interval | 1 secs |
| Statistics Interval | 4 secs |
| Track Length | 208.0 km |
| Units | |
| Flight instrument | |
| Type | Xc_tracer_ii |
| Model | Not Set |
| Firmware | Xc_tracer_ii_r09 |
| Height: | |
| Speed: | |
| Climb: | |
| Distance: |
| Main Map: |
| First Tab: |