


| Duration | 0:00 | Takeoff Distance | 0 |
| Height: | metres |
| Climb: | m/sec |
| Speed: | km/h |
| Distance: | km |
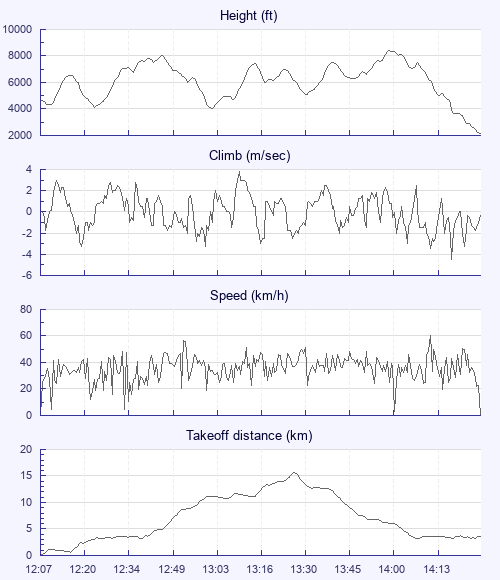
| Height - GPS data | |
| Maximum Height [14:01:54] |
8406 ft |
| Lowest Save [13:03:14] |
4009 ft |
| Takeoff Height [12:07:00] |
4659 ft |
| Landing Height [14:30:28] |
2188 ft |
| Total Ascent | 20453 ft |
| Height Gain | |
| Above Takeoff | 3747 ft |
| Maximum | 4396 ft |
| Low Point as Lowest Save |
4009 ft |
| High Point as Maximum Height |
8406 ft |
| Units | |
| Climb - Pressure data | |
| Maximum Climb [13:11:49] |
3.8 m/s |
| Minimum Climb [14:21:26] |
-4.5 m/s |
| Units | |
| Speed | |
| Maximum Speed [14:14:12] |
60.3 km/h |
| Average Speed around course |
17.4 km/h |
| Average Speed over track length |
35.5 km/h |
| Units | |
| Tracklog | |
| Flight Duration | 2hrs 23mins |
| Track Points | 5135 |
| Recording Interval | 2 secs |
| Statistics Interval | 4 secs |
| Track Length | 84.8 km |
| Units | |
| Flight instrument | |
| Type | Flyskyhy |
| Model | 6.13 |
| Firmware | 6.13 |
| Height: | |
| Speed: | |
| Climb: | |
| Distance: |
| Main Map: |
| First Tab: |