


| Duration | 0:00 | Takeoff Distance | 0 |
| Height: | metres |
| Climb: | m/sec |
| Speed: | km/h |
| Distance: | km |
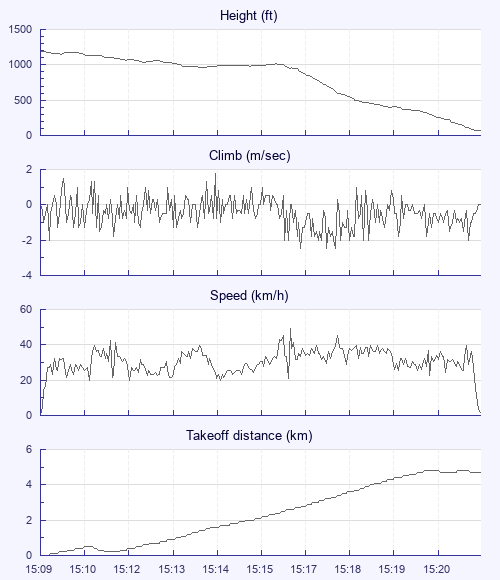
| Height - GPS data | |
| Maximum Height [15:09:48] |
1191 ft |
| Takeoff Height [15:09:48] |
1191 ft |
| Landing Height [15:22:13] |
66 ft |
| Total Ascent | 174 ft |
| Height Gain | |
| Above Takeoff | 0 ft |
| Maximum | 49 ft |
| Low Point [15:14:14] |
965 ft |
| High Point [15:16:19] |
1014 ft |
| Units | |
| Climb - Pressure data | |
| Maximum Climb [15:14:38] |
1.8 m/s |
| Minimum Climb [15:17:04] |
-2.5 m/s |
| Units | |
| Speed | |
| Maximum Speed [15:16:45] |
49.5 km/h |
| Average Speed around course |
28.1 km/h |
| Average Speed over track length |
30.9 km/h |
| Units | |
| Tracklog | |
| Flight Duration | 12mins |
| Track Points | 495 |
| Recording Interval | 2 secs |
| Statistics Interval | 4 secs |
| Track Length | 6.4 km |
| Units | |
| Flight instrument | |
| Type | Flyskyhy |
| Model | 6.13 |
| Firmware | 6.13 |
| Height: | |
| Speed: | |
| Climb: | |
| Distance: |
| Main Map: |
| First Tab: |