


| Duration | 0:00 | Takeoff Distance | 0 |
| Height: | metres |
| Climb: | m/sec |
| Speed: | km/h |
| Distance: | km |
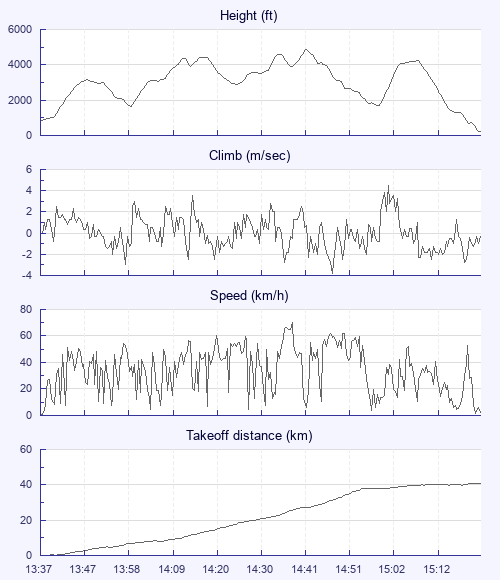
| Height - GPS data | |
| Maximum Height [14:42:39] |
4865 ft |
| Lowest Save [13:59:17] |
1667 ft |
| Takeoff Height [13:37:33] |
860 ft |
| Landing Height [15:24:40] |
210 ft |
| Total Ascent | 12917 ft |
| Height Gain | |
| Above Takeoff | 4006 ft |
| Maximum | 4016 ft |
| Low Point [13:37:39] |
850 ft |
| High Point as Maximum Height |
4865 ft |
| Units | |
| Climb - GPS data | |
| Maximum Climb [15:02:41] |
4.5 m/s |
| Minimum Climb [14:48:53] |
-3.8 m/s |
| Units | |
| Speed | |
| Maximum Speed [14:39:21] |
70.2 km/h |
| Average Speed around course |
26.4 km/h |
| Average Speed over track length |
34.8 km/h |
| Units | |
| Tracklog | |
| Flight Duration | 1hr 47mins |
| Track Points | 6428 |
| Recording Interval | 1 secs |
| Statistics Interval | 4 secs |
| Track Length | 62.2 km |
| Units | |
| Flight instrument | |
| Type | Motorola Xt1039 5.1 |
| Model | Not Set |
| Firmware | 0.8.2 |
| Height: | |
| Speed: | |
| Climb: | |
| Distance: |
| Main Map: |
| First Tab: |