


| Duration | 0:00 | Takeoff Distance | 0 |
| Height: | metres |
| Climb: | m/sec |
| Speed: | km/h |
| Distance: | km |
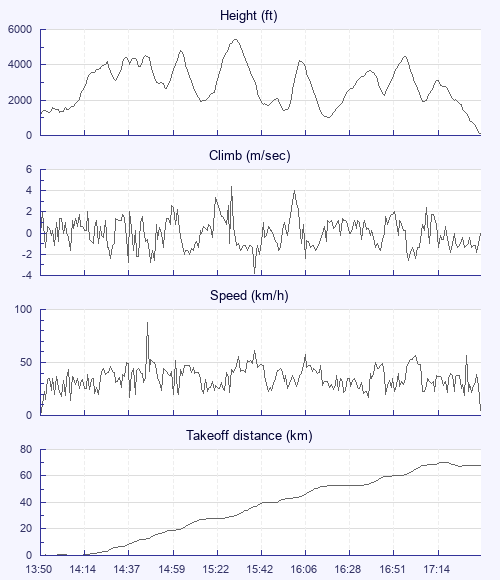
| Height - GPS data | |
| Maximum Height [15:31:23] |
5443 ft |
| Lowest Save [16:18:49] |
1024 ft |
| Takeoff Height [13:50:46] |
1184 ft |
| Landing Height [17:35:25] |
135 ft |
| Total Ascent | 21709 ft |
| Height Gain | |
| Above Takeoff | 4259 ft |
| Maximum | 4291 ft |
| Low Point [13:51:47] |
1152 ft |
| High Point as Maximum Height |
5443 ft |
| Units | |
| Climb - Pressure data | |
| Maximum Climb [15:30:28] |
4.4 m/s |
| Minimum Climb [15:40:29] |
-3.8 m/s |
| Units | |
| Speed | |
| Maximum Speed [14:46:57] |
87.8 km/h |
| Average Speed around course |
21.8 km/h |
| Average Speed over track length |
34.9 km/h |
| Units | |
| Tracklog | |
| Flight Duration | 3hrs 44mins |
| Track Points | 2637 |
| Recording Interval | 5 secs |
| Statistics Interval | 5 secs |
| Track Length | 130.7 km |
| Units | |
| Flight instrument | |
| Type | Flytec |
| Model | 6030 |
| Firmware | 5.02c |
| Height: | |
| Speed: | |
| Climb: | |
| Distance: |
| Main Map: |
| First Tab: |