Xc Title
User:Guest
Cloudbase Paragliding advert
Alistair Bowman  All flights
SHPF League 2019
Flight type image
Turnpoint Flight on a Paraglider
Club
SMPC
Glider
Gin Atlas
Date
26th February 2019
Start
12:41
Finish
13:39
Duration
57mins
Takeoff
Greenhill
Landing
Nr Wiston
Coords
Takeoff
55.58678, -3.69942
Start
55.58675, -3.70025
TP1
55.59008, -3.66330
TP2
55.58700, -3.70483
TP3
55.58867, -3.66317
Finish
55.58720, -3.71908
Landing
55.58267, -3.70558
Distances and Score
Leg 1
2.36k
Leg 2
2.64k
Leg 3
2.63k
Leg 4
3.53k
Total
11.16k
Score
11.2
Open Distance
Total
3.5k
Filename
Use full pilot name
Download
Validated
Yes
Flight map
Notes

This map gives an overview of the flight, using the turnpoints to plot the track.

Use the for a detailed map and flight track.

Duration 0:00   Takeoff Distance 0
Controls
To animate the flight: click a point on the track, use the slider, or click the Play button.
slider
slider
Speed
Speed
Slower
Faster
Track color
No data
Highlights
Track data
Time: No data
Height:
Climb:
Speed:
Interval:
Units
Height: metres
Climb: m/sec
Speed: km/h
Distance: km
chart
Notes

Climb and Speed averaged over 4 second intervals.

These values may be lower than those shown by a flight instrument, which has access to continuous raw data.

Metric units are used for all chart data, except for Height which is shown in feet.

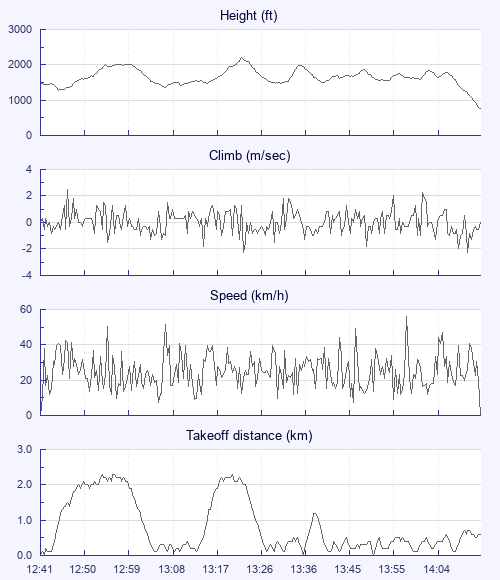
Height   -   Pressure data
Maximum Height
[13:23:46]
2198 ft
Lowest Save
[13:07:10]
1365 ft
Takeoff Height
[12:41:22]
1463 ft
Landing Height
[14:15:18]
774 ft
Total Ascent 5269 ft
Height Gain
Above Takeoff 735 ft
Maximum 919 ft
Low Point
[12:46:06]
1280 ft
High Point
as Maximum Height
2198 ft
Units
Climb   -   Pressure data
Maximum Climb
[12:46:38]
2.5 m/s
Minimum Climb
[13:24:06]
-2.3 m/s
Units
Speed
Maximum Speed
[13:59:14]
55.8 km/h
Average Speed
around course
11.6 km/h
Average Speed
over track length
25.1 km/h
Units
Tracklog
Flight Duration 1hr 33mins
Track Points 1410
Recording Interval 4 secs
Statistics Interval 4 secs
Track Length 39.3 km
Units
Flight instrument   -   reported as
XC Trainer V2.4-05, S/N 3619
Notes

Climb and Speed averaged over 4 second intervals.

These values may be lower than those shown by a flight instrument, which has access to continuous raw data.

Average Speed around course is measured from Start to Finish points.

Track Length is the cumulative distance between track points from Takeoff to Landing.

You can change the default units displayed - see the Options page.

Use this page to set various display Options. You can choose which units are used to display flight data, which map to show when the starts and which tab to show each time you view a flight.
Units settings

Metric units are used by default for the Statistics and XC Player pages, except for Height data which is shown in feet. You can choose your own custom settings here.

Height:
Speed:
Climb:
Distance:
  Use default
XC Player settings

When the XC Player starts, the track data is shown on the Hybrid map. You can choose a different map here.

Main Map:
  Use default
Tab settings

The first tab shown when you view a flight is the Flight Map. You can choose a different tab here.

First Tab:
  Use default
Notes

This page uses cookies to save your settings for future visits.

If you have disabled cookies for this site then any changes you make will not be saved.