


| Duration | 0:00 | Takeoff Distance | 0 |
| Height: | metres |
| Climb: | m/sec |
| Speed: | km/h |
| Distance: | km |
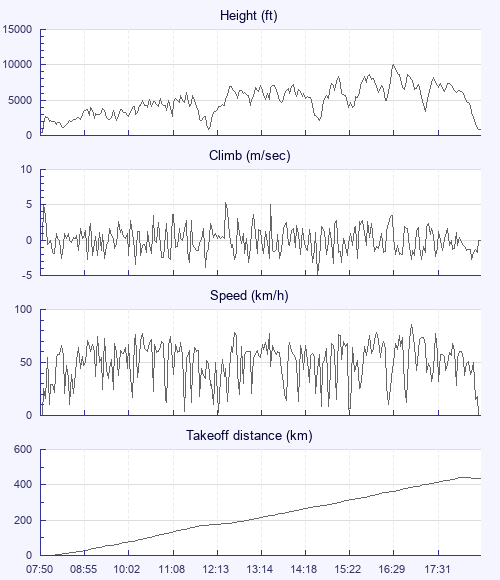
| Height - GPS data | |
| Maximum Height [16:38:15] |
10049 ft |
| Lowest Save [12:06:29] |
794 ft |
| Takeoff Height [07:50:44] |
404 ft |
| Landing Height [18:36:10] |
823 ft |
| Total Ascent | 98389 ft |
| Height Gain | |
| Above Takeoff | 9646 ft |
| Maximum | 9669 ft |
| Low Point [07:52:44] |
381 ft |
| High Point as Maximum Height |
10049 ft |
| Units | |
| Climb - Pressure data | |
| Maximum Climb [12:31:12] |
5.3 m/s |
| Minimum Climb [14:44:30] |
-4.9 m/s |
| Units | |
| Speed | |
| Maximum Speed [17:03:28] |
85.7 km/h |
| Average Speed around course |
42.8 km/h |
| Average Speed over track length |
48.8 km/h |
| Units | |
| Tracklog | |
| Flight Duration | 10hrs 45mins |
| Track Points | 3847 |
| Recording Interval | 10 secs |
| Statistics Interval | 10 secs |
| Track Length | 524.7 km |
| Units | |
| Flight instrument | |
| Type | Brauniger |
| Model | Compeo+ |
| Firmware | 3.38m |
| Height: | |
| Speed: | |
| Climb: | |
| Distance: |
| Main Map: |
| First Tab: |