


| Duration | 0:00 | Takeoff Distance | 0 |
| Height: | metres |
| Climb: | m/sec |
| Speed: | km/h |
| Distance: | km |
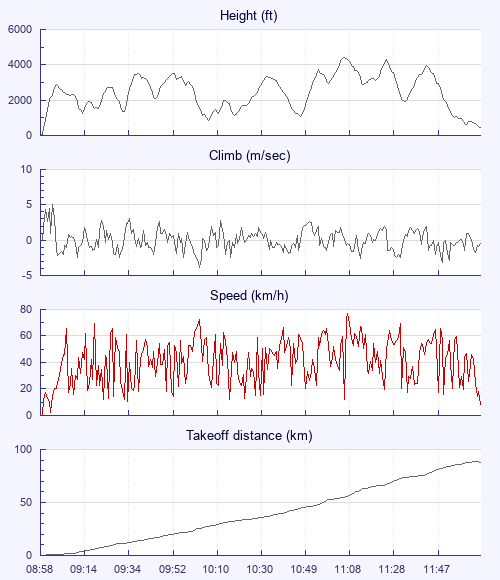
| Height - GPS data | |
| Maximum Height [11:08:16] |
4400 ft |
| Lowest Save [10:07:56] |
863 ft |
| Takeoff Height [08:58:51] |
62 ft |
| Landing Height [12:06:45] |
433 ft |
| Total Ascent | 25203 ft |
| Height Gain | |
| Above Takeoff | 4337 ft |
| Maximum | 4344 ft |
| Low Point [08:58:53] |
56 ft |
| High Point as Maximum Height |
4400 ft |
| Units | |
| Climb - Pressure data | |
| Maximum Climb [09:02:05] |
5.1 m/s |
| Minimum Climb [10:04:28] |
-3.8 m/s |
| Units | |
| Speed | |
| Maximum Speed [11:09:05] |
77.0 km/h |
| Average Speed around course |
29.8 km/h |
| Average Speed over track length |
40.9 km/h |
| Units | |
| Tracklog | |
| Flight Duration | 3hrs 7mins |
| Track Points | 7627 |
| Recording Interval | 1 secs |
| Statistics Interval | 4 secs |
| Track Length | 128.2 km |
| Invalid Positions [< 1%] |
19 |
| Units | |
| Flight instrument | |
| Type | Flyskyhy |
| Model | 6.13 |
| Firmware | 6.13 |
| Height: | |
| Speed: | |
| Climb: | |
| Distance: |
| Main Map: |
| First Tab: |