


| Duration | 0:00 | Takeoff Distance | 0 |
| Height: | metres |
| Climb: | m/sec |
| Speed: | km/h |
| Distance: | km |
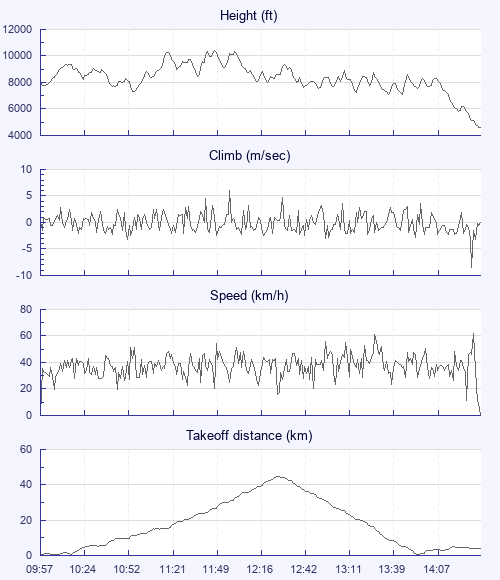
| Height - GPS data | |
| Maximum Height [11:51:21] |
10407 ft |
| Lowest Save [14:26:41] |
5846 ft |
| Takeoff Height [09:57:20] |
8018 ft |
| Landing Height [14:35:07] |
4629 ft |
| Total Ascent | 37070 ft |
| Height Gain | |
| Above Takeoff | 2388 ft |
| Maximum | 3228 ft |
| Low Point [10:58:01] |
7178 ft |
| High Point as Maximum Height |
10407 ft |
| Units | |
| Climb - GPS data | |
| Maximum Climb [12:00:56] |
6.0 m/s |
| Minimum Climb [14:32:53] |
-8.5 m/s |
| Units | |
| Speed | |
| Maximum Speed [14:32:57] |
62.1 km/h |
| Average Speed around course |
22.2 km/h |
| Average Speed over track length |
37.4 km/h |
| Units | |
| Tracklog | |
| Flight Duration | 4hrs 37mins |
| Track Points | 16664 |
| Recording Interval | 1 secs |
| Statistics Interval | 4 secs |
| Track Length | 173.2 km |
| Units | |
| Flight instrument - reported as | |
| Flymaster F1, V2.2, S/N 348 |
| Height: | |
| Speed: | |
| Climb: | |
| Distance: |
| Main Map: |
| First Tab: |