Xc Title
User:Guest
UK Airsports advert
Marcin Minkiewicz  All flights
Dunstable League 2019
Flight type image
Turnpoint Flight on a Paraglider
Club
Grupa 303
Glider
Air Design Volt 3
Date
7th April 2019
Start
16:38
Finish
18:29
Duration
1hr 51mins
Takeoff
Pandy
Landing
Nr Cwmyoy
Coords
Takeoff
51.90577, -2.99255
Start
51.90572, -2.99258
TP1
51.99982, -3.06730
TP2
51.89650, -2.97060
TP3
51.99997, -3.06982
Finish
51.89917, -2.97440
Landing
51.90540, -2.99280
Distances and Score
Leg 1
11.66k
Leg 2
13.28k
Leg 3
13.38k
Leg 4
12.99k
Total
51.31k
Score
51.3
Open Distance
Total
13.4k
Filename
Use full pilot name
Download
Validated
Yes
Flight map
Notes

This map gives an overview of the flight, using the turnpoints to plot the track.

Use the for a detailed map and flight track.

Duration 0:00   Takeoff Distance 0
Controls
To animate the flight: click a point on the track, use the slider, or click the Play button.
slider
slider
Speed
Speed
Slower
Faster
Track color
No data
Highlights
Track data
Time: No data
Height:
Climb:
Speed:
Interval:
Units
Height: metres
Climb: m/sec
Speed: km/h
Distance: km
chart
Notes

Climb and Speed averaged over 4 second intervals.

These values may be lower than those shown by a flight instrument, which has access to continuous raw data.

Red values indicate suspect data, because the tracklog contains invalid points.

Metric units are used for all chart data, except for Height which is shown in feet.

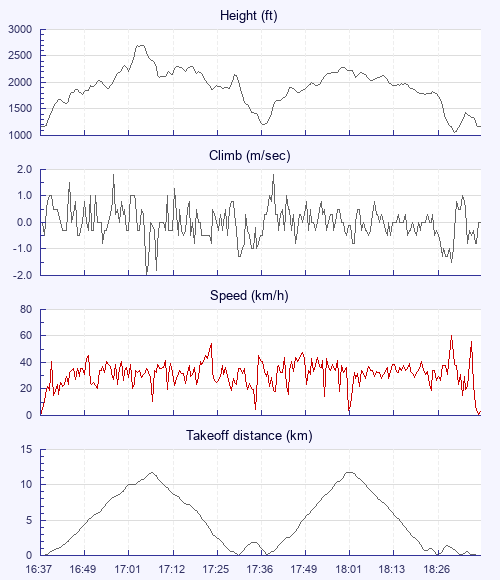
Height   -   Pressure data
Maximum Height
[17:05:39]
2697 ft
Lowest Save
[18:30:19]
1053 ft
Takeoff Height
[16:37:50]
1175 ft
Landing Height
[18:37:27]
1168 ft
Total Ascent 5144 ft
Height Gain
Above Takeoff 1522 ft
Maximum 1529 ft
Low Point
[16:38:06]
1168 ft
High Point
as Maximum Height
2697 ft
Units
Climb   -   Pressure data
Maximum Climb
[16:57:42]
1.8 m/s
Minimum Climb
[17:06:19]
-2.0 m/s
Units
Speed
Maximum Speed
[18:29:43]
60.3 km/h
Average Speed
around course
27.6 km/h
Average Speed
over track length
32.2 km/h
Units
Tracklog
Flight Duration 1hr 59mins
Track Points 3615
Recording Interval 2 secs
Statistics Interval 4 secs
Track Length 64.1 km
Invalid Positions
[< 1%]
1
Units
Flight instrument
Type Flyskyhy
Model 6.12
Firmware 6.12
Notes

Climb and Speed averaged over 4 second intervals.

These values may be lower than those shown by a flight instrument, which has access to continuous raw data.

Red values indicate suspect data, because the tracklog contains invalid points.

Average Speed around course is measured from Start to Finish points.

Track Length is the cumulative distance between track points from Takeoff to Landing.

You can change the default units displayed - see the Options page.

Use this page to set various display Options. You can choose which units are used to display flight data, which map to show when the starts and which tab to show each time you view a flight.
Units settings

Metric units are used by default for the Statistics and XC Player pages, except for Height data which is shown in feet. You can choose your own custom settings here.

Height:
Speed:
Climb:
Distance:
  Use default
XC Player settings

When the XC Player starts, the track data is shown on the Hybrid map. You can choose a different map here.

Main Map:
  Use default
Tab settings

The first tab shown when you view a flight is the Flight Map. You can choose a different tab here.

First Tab:
  Use default
Notes

This page uses cookies to save your settings for future visits.

If you have disabled cookies for this site then any changes you make will not be saved.