


| Duration | 0:00 | Takeoff Distance | 0 |
| Height: | metres |
| Climb: | m/sec |
| Speed: | km/h |
| Distance: | km |
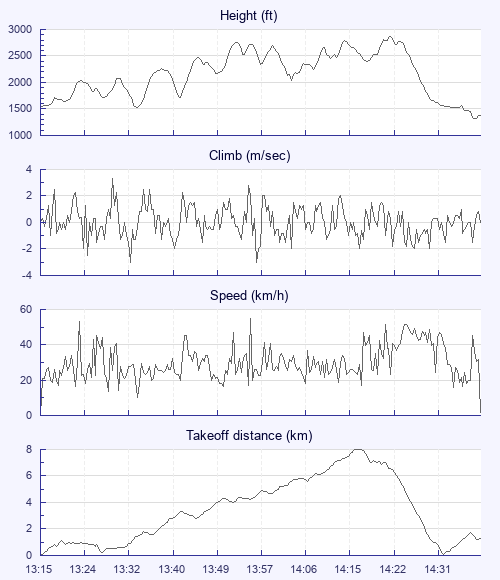
| Height - GPS data | |
| Maximum Height [14:24:02] |
2871 ft |
| Lowest Save [13:33:58] |
1529 ft |
| Takeoff Height [13:15:48] |
1519 ft |
| Landing Height [14:40:56] |
1378 ft |
| Total Ascent | 7520 ft |
| Height Gain | |
| Above Takeoff | 1352 ft |
| Units | |
| Climb - GPS data | |
| Maximum Climb [13:29:52] |
3.3 m/s |
| Minimum Climb [13:32:44] |
-3.0 m/s |
| Units | |
| Speed | |
| Maximum Speed [13:56:44] |
54.9 km/h |
| Average Speed around course |
14.9 km/h |
| Average Speed over track length |
30.6 km/h |
| Units | |
| Tracklog | |
| Flight Duration | 1hr 25mins |
| Track Points | 5109 |
| Recording Interval | 1 secs |
| Statistics Interval | 4 secs |
| Track Length | 43.4 km |
| Units | |
| Flight instrument | |
| Type | Sony F3111 7.0 |
| Model | Not Set |
| Firmware | 0.8.2 |
| Height: | |
| Speed: | |
| Climb: | |
| Distance: |
| Main Map: |
| First Tab: |