Xc Title
User:Guest
Ozone advert
Mike Byfield  All flights
National League 2020
Flight type image
Turnpoint Flight on a Paraglider
Club
Avon
Glider
Advance OXA 3
Date
16th March 2020
Start
12:19
Finish
15:43
Duration
3hrs 24mins
Takeoff
Rybury
Landing
Quainton
Coords
Takeoff
51.37188, -1.88070
Start
51.37028, -1.88278
TP1
51.37947, -1.85012
TP2
51.37980, -1.86978
TP3
51.47287, -1.54057
Finish
51.87707, -0.91638
Landing
51.87682, -0.92705
Distances and Score
Leg 1
2.49k
Leg 2
1.37k
Leg 3
25.13k
Leg 4
62.34k
Total
91.33k
Score
91.3
Open Distance
Total
87.5k
Filename
Use full pilot name
Download
Validated
Yes
Flight map
Notes

This map gives an overview of the flight, using the turnpoints to plot the track.

Use the for a detailed map and flight track.

Duration 0:00   Takeoff Distance 0
Controls
To animate the flight: click a point on the track, use the slider, or click the Play button.
slider
slider
Speed
Speed
Slower
Faster
Track color
No data
Highlights
Track data
Time: No data
Height:
Climb:
Speed:
Interval:
Units
Height: metres
Climb: m/sec
Speed: km/h
Distance: km
chart
Notes

Climb and Speed averaged over 4 second intervals.

These values may be lower than those shown by a flight instrument, which has access to continuous raw data.

Metric units are used for all chart data, except for Height which is shown in feet.

Height   -   GPS data
Maximum Height
[12:38:25]
3904 ft
Lowest Save
[15:07:55]
2060 ft
Takeoff Height
[12:11:20]
768 ft
Landing Height
[15:49:33]
328 ft
Total Ascent 20653 ft
Height Gain
Above Takeoff 3136 ft
Maximum 3228 ft
Low Point
[12:19:18]
676 ft
High Point
as Maximum Height
3904 ft
Units
Climb   -   GPS data
Maximum Climb
[14:13:12]
3.3 m/s
Minimum Climb
[12:49:24]
-4.0 m/s
Units
Speed
Maximum Speed
[14:52:20]
70.2 km/h
Average Speed
around course
26.9 km/h
Average Speed
over track length
38.4 km/h
Units
Tracklog
Flight Duration 3hrs 38mins
Track Points 13094
Recording Interval 1 secs
Statistics Interval 4 secs
Track Length 139.8 km
Units
Flight instrument   -   reported as
Flymaster F1, V2.3, S/N 425
Notes

Climb and Speed averaged over 4 second intervals.

These values may be lower than those shown by a flight instrument, which has access to continuous raw data.

Average Speed around course is measured from Start to Finish points.

Track Length is the cumulative distance between track points from Takeoff to Landing.

You can change the default units displayed - see the Options page.

Rybury was sunny with light winds which picked up significantly during the thermal cycles. A good group were in attendance with the likes of Craig, Charles, Nik, Steve, Andrew etc coming out to play.

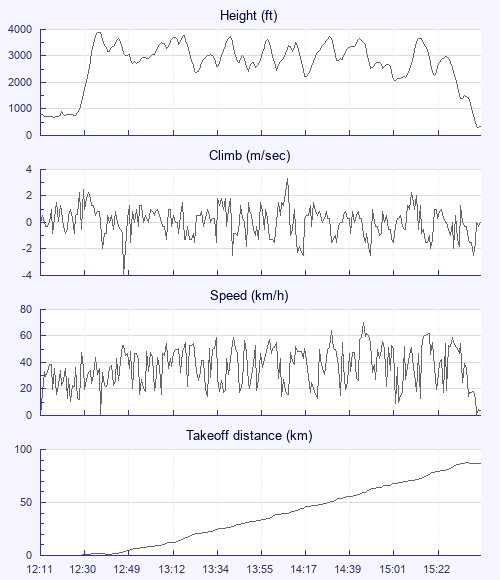
Having only had 8 minutes on the new OXA 3 I was keen to get in at least an hour of soaring to help me dial in to the joys of this 2 liner. Or so I thought. Clouds were popping and thermals bursting through with sustained gusts gave early hints of the potential of this post cold frontal day.

The take-off characteristics of the OXA were somewhat 'perky' but thereafter I comfortably scratched around low on the ridge for what seemed ages before a solid 2 up lifted me clear and up to base. The glider had originally felt unresponsive, but following a few adjustments to the harness its true nature began to emerge. Once high I pushed back into wind to the hill whilst others climbed out, then joined Charles and Craig, the Zeno Duo, and off we went.

The clouds were working well allowing us to push on at a reasonable pace and enjoy well-spaced climbs. The plan was simple - follow Craig and Charles! Craig led out and we all spread out in thermals and on glides in search of the best lift. All worked well until my phone ran out of juice, so no more FlySkyHy. Time to land.

The first guy I spoke to offered me a lift to the local branch line station, then onto the main station once we got into conversation. No corona virus fears here!

First proper flight on the OXA 3 - Impressions are wow! Thanks Carlo.

Use this page to set various display Options. You can choose which units are used to display flight data, which map to show when the starts and which tab to show each time you view a flight.
Units settings

Metric units are used by default for the Statistics and XC Player pages, except for Height data which is shown in feet. You can choose your own custom settings here.

Height:
Speed:
Climb:
Distance:
  Use default
XC Player settings

When the XC Player starts, the track data is shown on the Hybrid map. You can choose a different map here.

Main Map:
  Use default
Tab settings

The first tab shown when you view a flight is the Flight Map. You can choose a different tab here.

First Tab:
  Use default
Notes

This page uses cookies to save your settings for future visits.

If you have disabled cookies for this site then any changes you make will not be saved.