


| Duration | 0:00 | Takeoff Distance | 0 |
| Height: | metres |
| Climb: | m/sec |
| Speed: | km/h |
| Distance: | km |
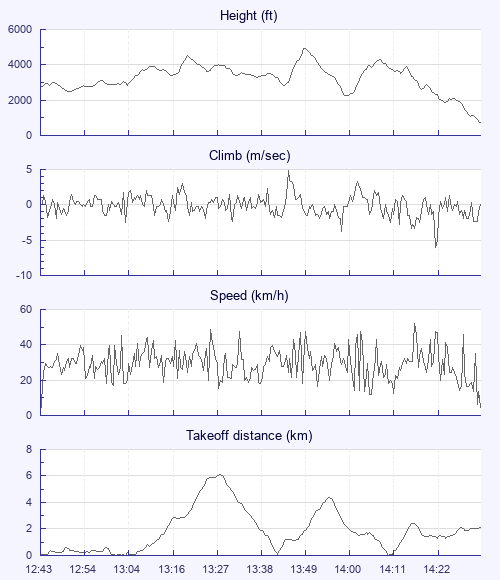
| Height - GPS data | |
| Maximum Height [13:50:39] |
4941 ft |
| Lowest Save [14:01:01] |
2257 ft |
| Takeoff Height [12:43:26] |
2759 ft |
| Landing Height [14:35:05] |
715 ft |
| Total Ascent | 11844 ft |
| Height Gain | |
| Above Takeoff | 2182 ft |
| Maximum | 2467 ft |
| Low Point [12:50:36] |
2474 ft |
| High Point as Maximum Height |
4941 ft |
| Units | |
| Climb - Pressure data | |
| Maximum Climb [13:46:45] |
4.8 m/s |
| Minimum Climb [14:23:21] |
-6.0 m/s |
| Units | |
| Speed | |
| Maximum Speed [14:18:09] |
52.2 km/h |
| Average Speed around course |
17.5 km/h |
| Average Speed over track length |
28.8 km/h |
| Units | |
| Tracklog | |
| Flight Duration | 1hr 51mins |
| Track Points | 3403 |
| Recording Interval | 2 secs |
| Statistics Interval | 4 secs |
| Track Length | 53.5 km |
| Units | |
| Flight instrument | |
| Type | Oudie 3 |
| Model | Not Set |
| Firmware | 9.22.001 |
| Height: | |
| Speed: | |
| Climb: | |
| Distance: |
| Main Map: |
| First Tab: |