


| Duration | 0:00 | Takeoff Distance | 0 |
| Height: | metres |
| Climb: | m/sec |
| Speed: | km/h |
| Distance: | km |
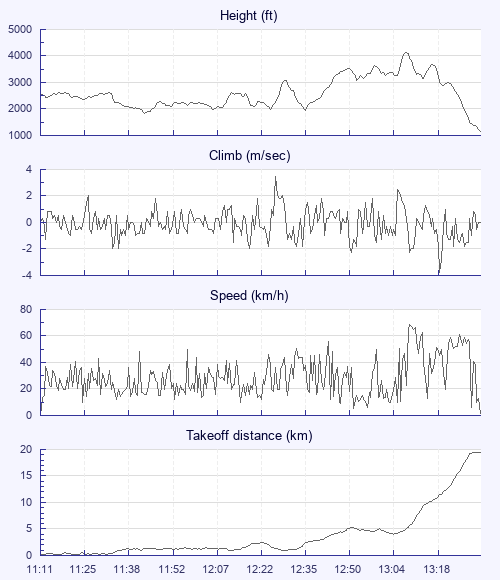
| Height - GPS data | |
| Maximum Height [13:08:02] |
4121 ft |
| Lowest Save [11:43:08] |
1844 ft |
| Takeoff Height [11:11:53] |
2543 ft |
| Landing Height [13:31:06] |
1148 ft |
| Total Ascent | 10725 ft |
| Height Gain | |
| Above Takeoff | 1578 ft |
| Maximum | 2277 ft |
| Low Point as Lowest Save |
1844 ft |
| High Point as Maximum Height |
4121 ft |
| Units | |
| Climb - Pressure data | |
| Maximum Climb [12:25:24] |
3.5 m/s |
| Minimum Climb [13:18:28] |
-3.8 m/s |
| Units | |
| Speed | |
| Maximum Speed [13:08:52] |
68.4 km/h |
| Average Speed around course |
9.6 km/h |
| Average Speed over track length |
29.3 km/h |
| Units | |
| Tracklog | |
| Flight Duration | 2hrs 19mins |
| Track Points | 4265 |
| Recording Interval | 2 secs |
| Statistics Interval | 4 secs |
| Track Length | 68.0 km |
| Units | |
| Flight instrument | |
| Type | Oudie 3 |
| Model | Not Set |
| Firmware | 9.22.001 |
| Height: | |
| Speed: | |
| Climb: | |
| Distance: |
| Main Map: |
| First Tab: |