


| Duration | 0:00 | Takeoff Distance | 0 |
| Height: | metres |
| Climb: | m/sec |
| Speed: | km/h |
| Distance: | km |
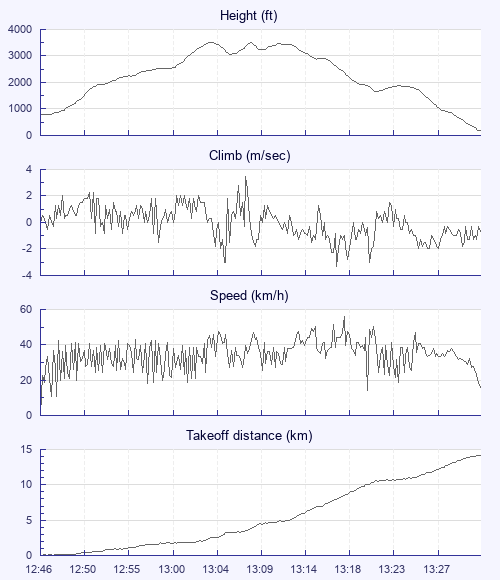
| Height - GPS data | |
| Maximum Height [13:04:39] |
3507 ft |
| Lowest Save [13:06:27] |
3064 ft |
| Takeoff Height [12:46:29] |
810 ft |
| Landing Height [13:32:51] |
203 ft |
| Total Ascent | 4170 ft |
| Height Gain | |
| Above Takeoff | 2697 ft |
| Maximum | 2723 ft |
| Low Point [12:46:35] |
784 ft |
| High Point as Maximum Height |
3507 ft |
| Units | |
| Climb - Pressure data | |
| Maximum Climb [13:08:05] |
3.5 m/s |
| Minimum Climb [13:17:45] |
-3.3 m/s |
| Units | |
| Speed | |
| Maximum Speed [13:18:29] |
55.8 km/h |
| Average Speed around course |
20.0 km/h |
| Average Speed over track length |
34.9 km/h |
| Units | |
| Tracklog | |
| Flight Duration | 46mins |
| Track Points | 2783 |
| Recording Interval | 1 secs |
| Statistics Interval | 4 secs |
| Track Length | 27.0 km |
| Units | |
| Flight instrument | |
| Type | Xc_tracer_ii_flarm |
| Model | Not Set |
| Firmware | Xc_tracer_flarm_r08 |
| Height: | |
| Speed: | |
| Climb: | |
| Distance: |
| Main Map: |
| First Tab: |