


| Duration | 0:00 | Takeoff Distance | 0 |
| Height: | metres |
| Climb: | m/sec |
| Speed: | km/h |
| Distance: | km |
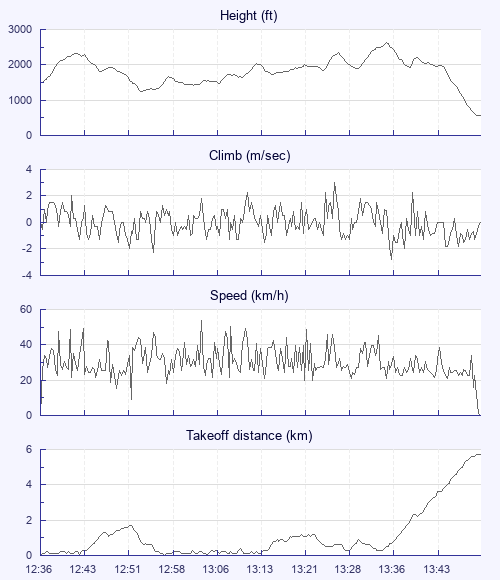
| Height - GPS data | |
| Maximum Height [13:36:56] |
2621 ft |
| Takeoff Height [12:36:41] |
1490 ft |
| Landing Height [13:52:28] |
561 ft |
| Total Ascent | 6155 ft |
| Height Gain | |
| Above Takeoff | 1132 ft |
| Maximum | 1388 ft |
| Low Point [12:53:16] |
1234 ft |
| High Point as Maximum Height |
2621 ft |
| Units | |
| Climb - GPS data | |
| Maximum Climb [13:27:53] |
3.0 m/s |
| Minimum Climb [13:37:25] |
-2.8 m/s |
| Units | |
| Speed | |
| Maximum Speed [13:04:21] |
54.0 km/h |
| Average Speed around course |
10.0 km/h |
| Average Speed over track length |
30.5 km/h |
| Units | |
| Tracklog | |
| Flight Duration | 1hr 15mins |
| Track Points | 4548 |
| Recording Interval | 1 secs |
| Statistics Interval | 4 secs |
| Track Length | 38.5 km |
| Units | |
| Flight instrument | |
| Type | Samsung Sm-a137f 13 |
| Model | Not Set |
| Firmware | 0.9.10.4 |
| Height: | |
| Speed: | |
| Climb: | |
| Distance: |
| Main Map: |
| First Tab: |