


| Duration | 0:00 | Takeoff Distance | 0 |
| Height: | metres |
| Climb: | m/sec |
| Speed: | km/h |
| Distance: | km |
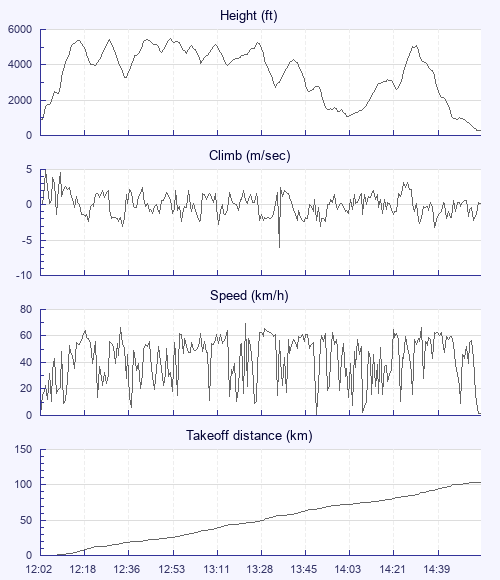
| Height - GPS data | |
| Maximum Height [12:54:02] |
5482 ft |
| Lowest Save [14:07:12] |
1050 ft |
| Takeoff Height [12:02:16] |
912 ft |
| Landing Height [15:00:28] |
276 ft |
| Total Ascent | 21437 ft |
| Height Gain | |
| Above Takeoff | 4570 ft |
| Units | |
| Climb - GPS data | |
| Maximum Climb [12:03:31] |
5.0 m/s |
| Minimum Climb [13:38:47] |
-6.0 m/s |
| Units | |
| Speed | |
| Maximum Speed [13:25:07] |
69.8 km/h |
| Average Speed around course |
35.8 km/h |
| Average Speed over track length |
44.1 km/h |
| Units | |
| Tracklog | |
| Flight Duration | 2hrs 58mins |
| Track Points | 2137 |
| Recording Interval | 5 secs |
| Statistics Interval | 5 secs |
| Track Length | 131.0 km |
| Units | |
| Flight instrument - reported as | |
| GPSMAP 76 Software Version 3.90 |
| Height: | |
| Speed: | |
| Climb: | |
| Distance: |
| Main Map: |
| First Tab: |