


| Duration | 0:00 | Takeoff Distance | 0 |
| Height: | metres |
| Climb: | m/sec |
| Speed: | km/h |
| Distance: | km |
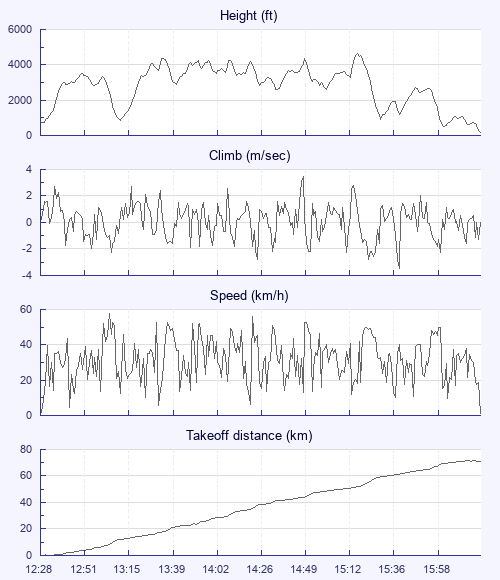
| Height - GPS data | |
| Maximum Height [15:19:54] |
4656 ft |
| Lowest Save [16:05:54] |
518 ft |
| Takeoff Height [12:28:54] |
673 ft |
| Landing Height [16:23:54] |
194 ft |
| Total Ascent | 23107 ft |
| Height Gain | |
| Above Takeoff | 3983 ft |
| Units | |
| Climb - GPS data | |
| Maximum Climb [14:50:04] |
3.5 m/s |
| Minimum Climb [15:42:14] |
-3.5 m/s |
| Units | |
| Speed | |
| Maximum Speed [13:05:54] |
57.6 km/h |
| Average Speed around course |
19.5 km/h |
| Average Speed over track length |
32.1 km/h |
| Units | |
| Tracklog | |
| Flight Duration | 3hrs 55mins |
| Track Points | 1411 |
| Recording Interval | 10 secs |
| Statistics Interval | 10 secs |
| Track Length | 125.7 km |
| Units | |
| Flight instrument - reported as | |
| XC Trainer V3.2-07, S/N 4129 |
| Height: | |
| Speed: | |
| Climb: | |
| Distance: |
| Main Map: |
| First Tab: |