


| Duration | 0:00 | Takeoff Distance | 0 |
| Height: | metres |
| Climb: | m/sec |
| Speed: | km/h |
| Distance: | km |
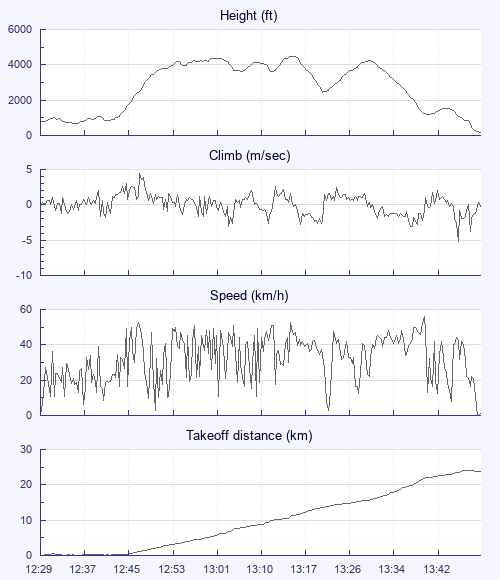
| Height - GPS data | |
| Maximum Height [13:16:41] |
4488 ft |
| Lowest Save [13:43:21] |
1188 ft |
| Takeoff Height [12:29:21] |
774 ft |
| Landing Height [13:52:01] |
190 ft |
| Total Ascent | 8901 ft |
| Height Gain | |
| Above Takeoff | 3714 ft |
| Maximum | 3829 ft |
| Low Point [12:35:41] |
659 ft |
| High Point as Maximum Height |
4488 ft |
| Units | |
| Climb - GPS data | |
| Maximum Climb [12:47:46] |
4.4 m/s |
| Minimum Climb [13:48:31] |
-5.2 m/s |
| Units | |
| Speed | |
| Maximum Speed [13:42:01] |
56.2 km/h |
| Average Speed around course |
21.5 km/h |
| Average Speed over track length |
32.2 km/h |
| Units | |
| Tracklog | |
| Flight Duration | 1hr 22mins |
| Track Points | 993 |
| Recording Interval | 5 secs |
| Statistics Interval | 5 secs |
| Track Length | 44.3 km |
| Units | |
| Flight instrument - reported as | |
| GPSMap76C Software Version 3.20 |
| Height: | |
| Speed: | |
| Climb: | |
| Distance: |
| Main Map: |
| First Tab: |