Xc Title
User:Guest
Ozone advert
Brendan Reid  All flights
National League 2012
Flight type image
Turnpoint Flight on a Paraglider
Club
LLSC
Glider
Ozone Mantra R10.2
Date
1st April 2012
Start
11:56
Finish
17:10
Duration
5hrs 13mins
Takeoff
Bradwell
Landing
Wisbech
Coords
Takeoff
53.32125, -1.72992
Start
53.32108, -1.73053
TP1
53.32717, -1.73113
TP2
52.92483, -0.90208
TP3
52.92542, -0.78905
Finish
52.65717, 0.14522
Landing
52.65820, 0.14425
Distances and Score
Leg 1
0.68k
Leg 2
71.31k
Leg 3
7.60k
Leg 4
69.74k
Total
149.33k
Score
149.3
Open Distance
Total
146.4k
Filename
Use full pilot name
Download
Validated
Yes
Flight map
Notes

This map gives an overview of the flight, using the turnpoints to plot the track.

Use the for a detailed map and flight track.

Duration 0:00   Takeoff Distance 0
Controls
To animate the flight: click a point on the track, use the slider, or click the Play button.
slider
slider
Speed
Speed
Slower
Faster
Track color
No data
Highlights
Track data
Time: No data
Height:
Climb:
Speed:
Interval:
Units
Height: metres
Climb: m/sec
Speed: km/h
Distance: km
chart
Notes

Climb and Speed averaged over 4 second intervals.

These values may be lower than those shown by a flight instrument, which has access to continuous raw data.

Red values indicate suspect data, because the tracklog contains invalid points.

Metric units are used for all chart data, except for Height which is shown in feet.

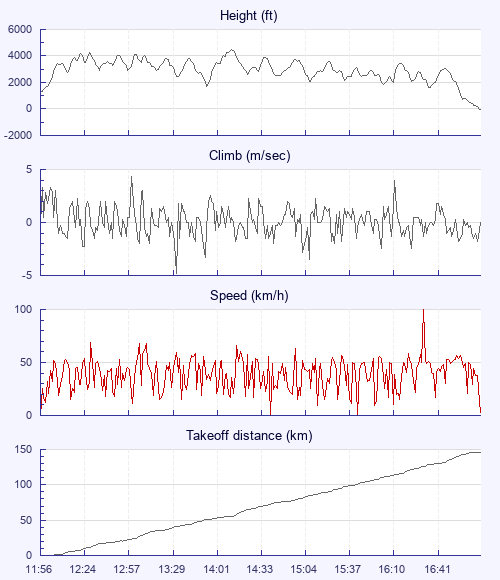
Height   -   Pressure data
Maximum Height
[14:13:27]
4488 ft
Lowest Save
[16:38:39]
1660 ft
Takeoff Height
[11:56:43]
1217 ft
Landing Height
[17:12:31]
-13 ft
Total Ascent 30082 ft
Height Gain
Above Takeoff 3271 ft
Units
Climb   -   Pressure data
Maximum Climb
[12:59:23]
4.3 m/s
Minimum Climb
[13:32:35]
-4.8 m/s
Units
Speed
Maximum Speed
[16:35:51]
99.9 km/h
Average Speed
around course
28.5 km/h
Average Speed
over track length
40.7 km/h
Units
Tracklog
Flight Duration 5hrs 15mins
Track Points 4738
Recording Interval 4 secs
Statistics Interval 4 secs
Track Length 214.4 km
Invalid Positions
[< 1%]
35
Units
Flight instrument   -   reported as
XC Trainer V3.3-09, S/N 4236
Notes

Climb and Speed averaged over 4 second intervals.

These values may be lower than those shown by a flight instrument, which has access to continuous raw data.

Red values indicate suspect data, because the tracklog contains invalid points.

Average Speed around course is measured from Start to Finish points.

Track Length is the cumulative distance between track points from Takeoff to Landing.

You can change the default units displayed - see the Options page.

Use this page to set various display Options. You can choose which units are used to display flight data, which map to show when the starts and which tab to show each time you view a flight.
Units settings

Metric units are used by default for the Statistics and XC Player pages, except for Height data which is shown in feet. You can choose your own custom settings here.

Height:
Speed:
Climb:
Distance:
  Use default
XC Player settings

When the XC Player starts, the track data is shown on the Hybrid map. You can choose a different map here.

Main Map:
  Use default
Tab settings

The first tab shown when you view a flight is the Flight Map. You can choose a different tab here.

First Tab:
  Use default
Notes

This page uses cookies to save your settings for future visits.

If you have disabled cookies for this site then any changes you make will not be saved.