


| Duration | 0:00 | Takeoff Distance | 0 |
| Height: | metres |
| Climb: | m/sec |
| Speed: | km/h |
| Distance: | km |
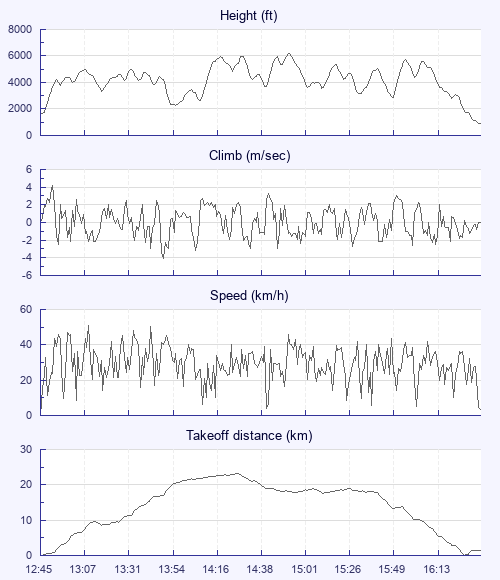
| Height - GPS data | |
| Maximum Height [14:57:47] |
6178 ft |
| Lowest Save [13:58:15] |
2297 ft |
| Takeoff Height [12:45:29] |
1663 ft |
| Landing Height [16:41:28] |
922 ft |
| Total Ascent | 26427 ft |
| Height Gain | |
| Above Takeoff | 4514 ft |
| Units | |
| Climb - Pressure data | |
| Maximum Climb [12:51:11] |
4.2 m/s |
| Minimum Climb [13:51:54] |
-4.1 m/s |
| Units | |
| Speed | |
| Maximum Speed [13:10:36] |
51.1 km/h |
| Average Speed around course |
16.4 km/h |
| Average Speed over track length |
28.5 km/h |
| Units | |
| Tracklog | |
| Flight Duration | 3hrs 55mins |
| Track Points | 1412 |
| Recording Interval | 10 secs |
| Statistics Interval | 10 secs |
| Track Length | 112.0 km |
| Units | |
| Flight instrument - reported as | |
| COMPETINO SN01453 SW1.21 |
| Height: | |
| Speed: | |
| Climb: | |
| Distance: |
| Main Map: |
| First Tab: |