


| Duration | 0:00 | Takeoff Distance | 0 |
| Height: | metres |
| Climb: | m/sec |
| Speed: | km/h |
| Distance: | km |
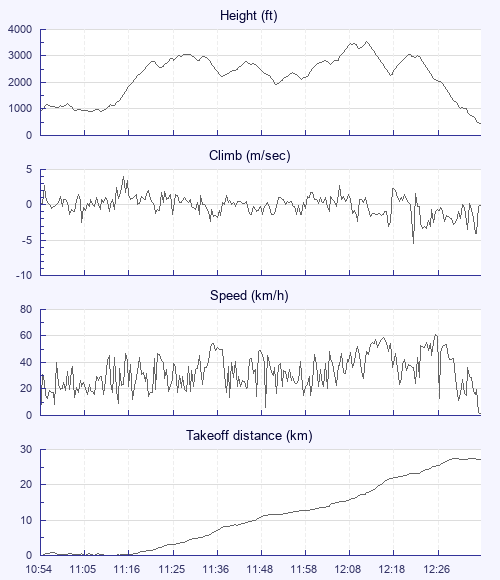
| Height - GPS data | |
| Maximum Height [12:13:40] |
3550 ft |
| Lowest Save [11:52:18] |
1932 ft |
| Takeoff Height [10:54:28] |
922 ft |
| Landing Height [12:36:02] |
466 ft |
| Total Ascent | 8310 ft |
| Height Gain | |
| Above Takeoff | 2628 ft |
| Maximum | 2657 ft |
| Low Point [11:11:01] |
892 ft |
| High Point as Maximum Height |
3550 ft |
| Units | |
| Climb - GPS data | |
| Maximum Climb [11:15:41] |
4.0 m/s |
| Minimum Climb [12:23:39] |
-5.5 m/s |
| Units | |
| Speed | |
| Maximum Speed [12:27:11] |
61.2 km/h |
| Average Speed around course |
18.9 km/h |
| Average Speed over track length |
32.0 km/h |
| Units | |
| Tracklog | |
| Flight Duration | 1hr 41mins |
| Track Points | 1868 |
| Recording Interval | 3 secs |
| Statistics Interval | 6 secs |
| Track Length | 54.1 km |
| Units | |
| Flight instrument - reported as | |
| GPSMap76CSX Software Version 3.50 |
| Height: | |
| Speed: | |
| Climb: | |
| Distance: |
| Main Map: |
| First Tab: |