


| Duration | 0:00 | Takeoff Distance | 0 |
| Height: | metres |
| Climb: | m/sec |
| Speed: | km/h |
| Distance: | km |
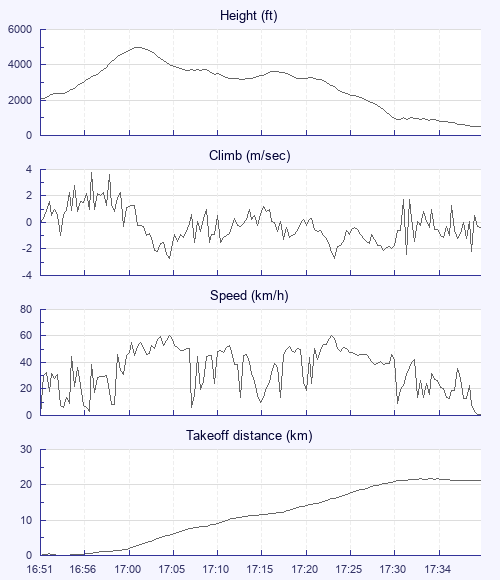
| Height - GPS data | |
| Maximum Height [17:01:57] |
4977 ft |
| Lowest Save [17:14:11] |
3192 ft |
| Takeoff Height [16:51:32] |
2070 ft |
| Landing Height [17:40:28] |
499 ft |
| Total Ascent | 4209 ft |
| Height Gain | |
| Above Takeoff | 2907 ft |
| Units | |
| Climb - GPS data | |
| Maximum Climb [16:57:04] |
3.8 m/s |
| Minimum Climb [17:05:47] |
-2.7 m/s |
| Units | |
| Speed | |
| Maximum Speed [17:24:11] |
60.5 km/h |
| Average Speed around course |
28.9 km/h |
| Average Speed over track length |
34.9 km/h |
| Units | |
| Tracklog | |
| Flight Duration | 48mins |
| Track Points | 294 |
| Recording Interval | 10 secs |
| Statistics Interval | 10 secs |
| Track Length | 28.5 km |
| Units | |
| Flight instrument - reported as | |
| Garmin USB: GPSMap60CSX Software Version 3.70 |
| Height: | |
| Speed: | |
| Climb: | |
| Distance: |
| Main Map: |
| First Tab: |