


| Duration | 0:00 | Takeoff Distance | 0 |
| Height: | metres |
| Climb: | m/sec |
| Speed: | km/h |
| Distance: | km |
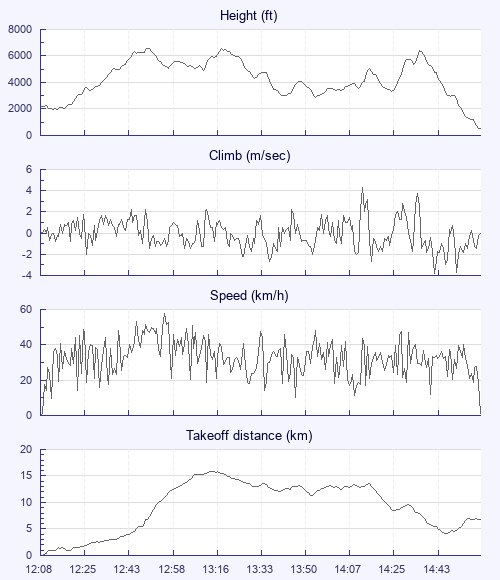
| Height - GPS data | |
| Maximum Height [12:51:11] |
6588 ft |
| Lowest Save [13:58:41] |
2894 ft |
| Takeoff Height [12:08:56] |
2139 ft |
| Landing Height [15:06:32] |
528 ft |
| Total Ascent | 18753 ft |
| Height Gain | |
| Above Takeoff | 4449 ft |
| Maximum | 4633 ft |
| Low Point [12:14:08] |
1955 ft |
| High Point as Maximum Height |
6588 ft |
| Units | |
| Climb - Pressure data | |
| Maximum Climb [14:18:17] |
4.3 m/s |
| Minimum Climb [14:47:53] |
-3.8 m/s |
| Units | |
| Speed | |
| Maximum Speed [12:57:47] |
57.6 km/h |
| Average Speed around course |
14.1 km/h |
| Average Speed over track length |
31.9 km/h |
| Units | |
| Tracklog | |
| Flight Duration | 2hrs 57mins |
| Track Points | 3572 |
| Recording Interval | 3 secs |
| Statistics Interval | 6 secs |
| Track Length | 94.4 km |
| Units | |
| Flight instrument - reported as | |
| IQ-BASIC |
| Height: | |
| Speed: | |
| Climb: | |
| Distance: |
| Main Map: |
| First Tab: |