


| Duration | 0:00 | Takeoff Distance | 0 |
| Height: | metres |
| Climb: | m/sec |
| Speed: | km/h |
| Distance: | km |
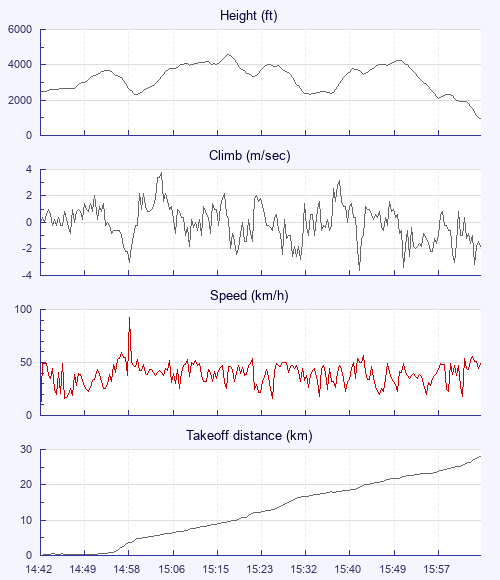
| Height - GPS data | |
| Maximum Height [15:18:43] |
4577 ft |
| Lowest Save [15:00:18] |
2297 ft |
| Takeoff Height [14:42:03] |
2421 ft |
| Landing Height [16:09:03] |
942 ft |
| Total Ascent | 8396 ft |
| Height Gain | |
| Above Takeoff | 2156 ft |
| Maximum | 2280 ft |
| Low Point as Lowest Save |
2297 ft |
| High Point as Maximum Height |
4577 ft |
| Units | |
| Climb - GPS data | |
| Maximum Climb [15:05:03] |
3.8 m/s |
| Minimum Climb [15:45:13] |
-3.6 m/s |
| Units | |
| Speed | |
| Maximum Speed [14:58:58] |
92.9 km/h |
| Average Speed around course |
22.1 km/h |
| Average Speed over track length |
38.1 km/h |
| Units | |
| Tracklog | |
| Flight Duration | 1hr 27mins |
| Track Points | 1045 |
| Recording Interval | 5 secs |
| Statistics Interval | 5 secs |
| Track Length | 55.3 km |
| Invalid Positions [< 1%] |
1 |
| Units | |
| Flight instrument - reported as | |
| GPSMAP 76S Software Version 3.20 - 194 |
| Height: | |
| Speed: | |
| Climb: | |
| Distance: |
| Main Map: |
| First Tab: |