


| Duration | 0:00 | Takeoff Distance | 0 |
| Height: | metres |
| Climb: | m/sec |
| Speed: | km/h |
| Distance: | km |
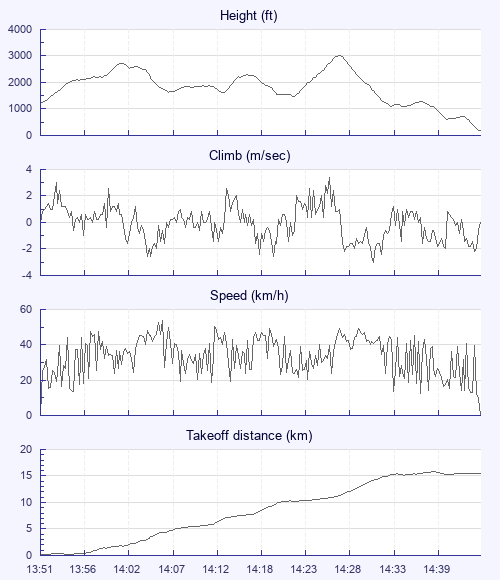
| Height - GPS data | |
| Maximum Height [14:28:41] |
3015 ft |
| Lowest Save [14:23:11] |
1476 ft |
| Takeoff Height [13:51:41] |
1220 ft |
| Landing Height [14:45:46] |
187 ft |
| Total Ascent | 5059 ft |
| Height Gain | |
| Above Takeoff | 1795 ft |
| Units | |
| Climb - Pressure data | |
| Maximum Climb [14:27:26] |
3.4 m/s |
| Minimum Climb [14:32:41] |
-3.0 m/s |
| Units | |
| Speed | |
| Maximum Speed [14:06:26] |
54.0 km/h |
| Average Speed around course |
20.5 km/h |
| Average Speed over track length |
33.5 km/h |
| Units | |
| Tracklog | |
| Flight Duration | 54mins |
| Track Points | 651 |
| Recording Interval | 5 secs |
| Statistics Interval | 5 secs |
| Track Length | 30.2 km |
| Units | |
| Flight instrument - reported as | |
| SKYTRAXX V1.28 SN:1885377462 |
| Height: | |
| Speed: | |
| Climb: | |
| Distance: |
| Main Map: |
| First Tab: |