


| Duration | 0:00 | Takeoff Distance | 0 |
| Height: | metres |
| Climb: | m/sec |
| Speed: | km/h |
| Distance: | km |
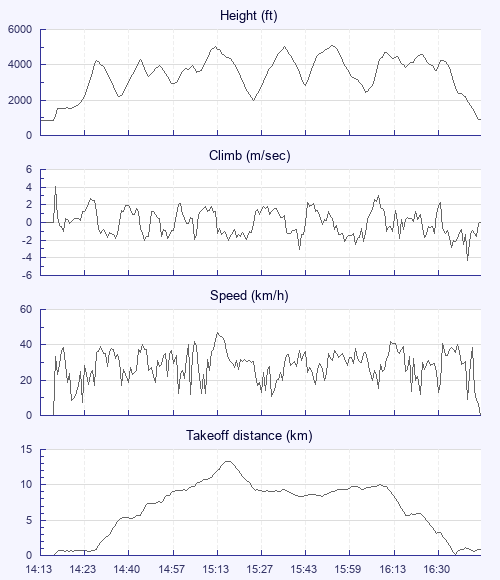
| Height - GPS data | |
| Maximum Height [15:54:46] |
5102 ft |
| Lowest Save [15:24:38] |
1969 ft |
| Takeoff Height [14:13:00] |
853 ft |
| Landing Height [16:44:20] |
902 ft |
| Total Ascent | 18412 ft |
| Height Gain | |
| Above Takeoff | 4249 ft |
| Units | |
| Climb - Pressure data | |
| Maximum Climb [14:14:51] |
4.1 m/s |
| Minimum Climb [16:40:21] |
-4.3 m/s |
| Units | |
| Speed | |
| Maximum Speed [15:13:54] |
47.0 km/h |
| Average Speed around course |
14.8 km/h |
| Average Speed over track length |
27.7 km/h |
| Units | |
| Tracklog | |
| Flight Duration | 2hrs 31mins |
| Track Points | 607 |
| Recording Interval | 15 secs |
| Statistics Interval | 15 secs |
| Track Length | 69.8 km |
| Units | |
| Flight instrument | |
| Type | Oudie 3 |
| Model | Not Set |
| Firmware | 5.20.001 |
| Height: | |
| Speed: | |
| Climb: | |
| Distance: |
| Main Map: |
| First Tab: |