


| Duration | 0:00 | Takeoff Distance | 0 |
| Height: | metres |
| Climb: | m/sec |
| Speed: | km/h |
| Distance: | km |
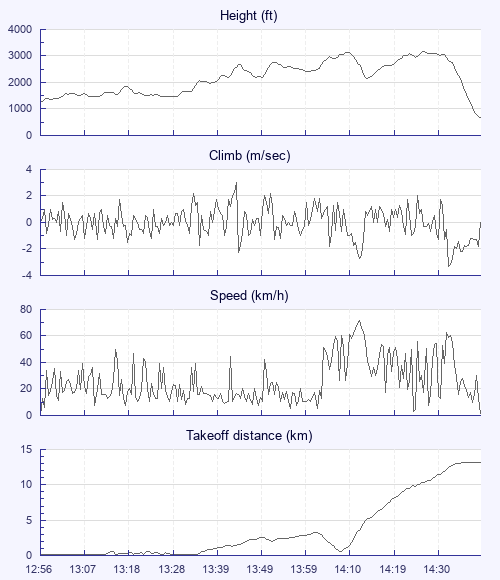
| Height - GPS data | |
| Maximum Height [14:30:42] |
3159 ft |
| Lowest Save [14:17:02] |
2169 ft |
| Takeoff Height [12:56:54] |
1286 ft |
| Landing Height [14:42:20] |
682 ft |
| Total Ascent | 5315 ft |
| Height Gain | |
| Above Takeoff | 1873 ft |
| Maximum | 1877 ft |
| Low Point [12:57:00] |
1283 ft |
| High Point as Maximum Height |
3159 ft |
| Units | |
| Climb - Pressure data | |
| Maximum Climb [13:45:26] |
3.0 m/s |
| Minimum Climb [14:36:27] |
-3.3 m/s |
| Units | |
| Speed | |
| Maximum Speed [14:15:18] |
71.4 km/h |
| Average Speed around course |
16.9 km/h |
| Average Speed over track length |
25.4 km/h |
| Units | |
| Tracklog | |
| Flight Duration | 1hr 45mins |
| Track Points | 2075 |
| Recording Interval | 3 secs |
| Statistics Interval | 6 secs |
| Track Length | 44.6 km |
| Units | |
| Flight instrument - reported as | |
| 5020 SN05549 SW1.18 |
| Height: | |
| Speed: | |
| Climb: | |
| Distance: |
| Main Map: |
| First Tab: |