


| Duration | 0:00 | Takeoff Distance | 0 |
| Height: | metres |
| Climb: | m/sec |
| Speed: | km/h |
| Distance: | km |
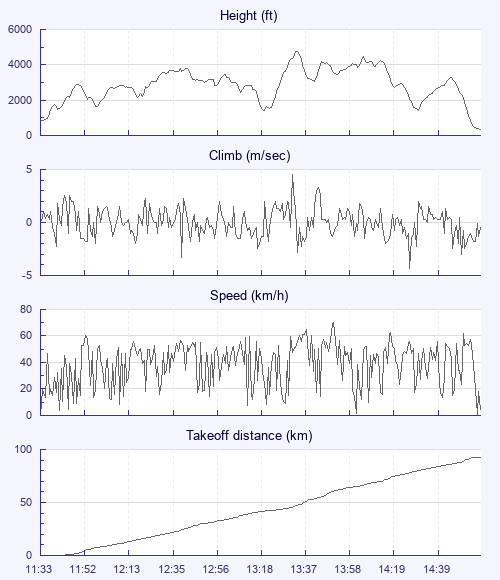
| Height - GPS data | |
| Maximum Height [13:36:43] |
4754 ft |
| Lowest Save [13:22:00] |
1391 ft |
| Takeoff Height [11:33:43] |
830 ft |
| Landing Height [15:02:22] |
335 ft |
| Total Ascent | 20574 ft |
| Height Gain | |
| Above Takeoff | 3924 ft |
| Maximum | 3947 ft |
| Low Point [11:34:13] |
807 ft |
| High Point as Maximum Height |
4754 ft |
| Units | |
| Climb - Pressure data | |
| Maximum Climb [13:35:32] |
4.5 m/s |
| Minimum Climb [14:31:05] |
-4.3 m/s |
| Units | |
| Speed | |
| Maximum Speed [13:54:20] |
70.2 km/h |
| Average Speed around course |
27.6 km/h |
| Average Speed over track length |
38.8 km/h |
| Units | |
| Tracklog | |
| Flight Duration | 3hrs 28mins |
| Track Points | 12512 |
| Recording Interval | 1 secs |
| Statistics Interval | 4 secs |
| Track Length | 135.0 km |
| Units | |
| Flight instrument | |
| Type | Xc_tracer_ii |
| Model | Not Set |
| Firmware | Xc_tracer_ii_r01.2 |
| Height: | |
| Speed: | |
| Climb: | |
| Distance: |
| Main Map: |
| First Tab: |