


| Duration | 0:00 | Takeoff Distance | 0 |
| Height: | metres |
| Climb: | m/sec |
| Speed: | km/h |
| Distance: | km |
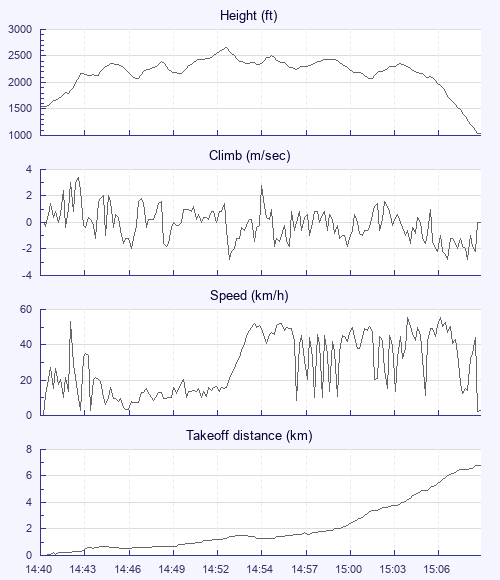
| Height - GPS data | |
| Maximum Height [14:53:15] |
2667 ft |
| Takeoff Height [14:40:38] |
1552 ft |
| Landing Height [15:09:40] |
1047 ft |
| Total Ascent | 2480 ft |
| Height Gain | |
| Above Takeoff | 1115 ft |
| Units | |
| Climb - Pressure data | |
| Maximum Climb [14:43:25] |
3.4 m/s |
| Minimum Climb [14:53:25] |
-2.8 m/s |
| Units | |
| Speed | |
| Maximum Speed [15:04:55] |
55.4 km/h |
| Average Speed around course |
21.9 km/h |
| Average Speed over track length |
27.9 km/h |
| Units | |
| Tracklog | |
| Flight Duration | 29mins |
| Track Points | 344 |
| Recording Interval | 5 secs |
| Statistics Interval | 5 secs |
| Track Length | 13.5 km |
| Units | |
| Flight instrument | |
| Type | Flytec |
| Model | 6015 |
| Firmware | 1.3.07 Eng |
| Height: | |
| Speed: | |
| Climb: | |
| Distance: |
| Main Map: |
| First Tab: |