


| Duration | 0:00 | Takeoff Distance | 0 |
| Height: | metres |
| Climb: | m/sec |
| Speed: | km/h |
| Distance: | km |
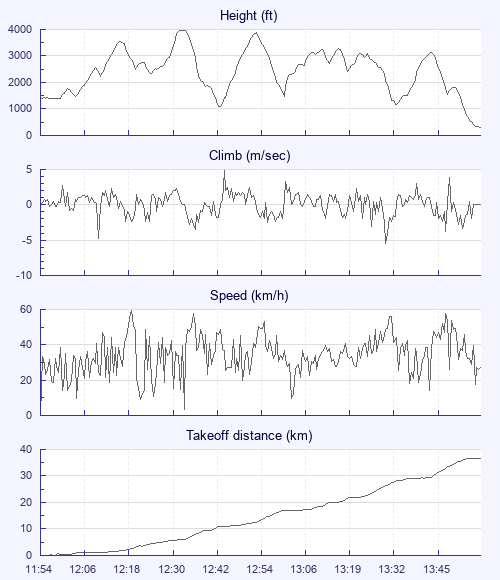
| Height - GPS data | |
| Maximum Height [12:33:11] |
3980 ft |
| Lowest Save [12:43:40] |
1096 ft |
| Takeoff Height [11:54:42] |
1358 ft |
| Landing Height [13:57:23] |
318 ft |
| Total Ascent | 15400 ft |
| Height Gain | |
| Above Takeoff | 2621 ft |
| Maximum | 2795 ft |
| Low Point as Lowest Save |
1096 ft |
| High Point [12:53:46] |
3891 ft |
| Units | |
| Climb - Pressure data | |
| Maximum Climb [12:44:43] |
4.8 m/s |
| Minimum Climb [13:31:29] |
-5.5 m/s |
| Units | |
| Speed | |
| Maximum Speed [12:19:40] |
59.4 km/h |
| Average Speed around course |
20.0 km/h |
| Average Speed over track length |
34.3 km/h |
| Units | |
| Tracklog | |
| Flight Duration | 2hrs 2mins |
| Track Points | 7292 |
| Recording Interval | 1 secs |
| Statistics Interval | 4 secs |
| Track Length | 70.2 km |
| Units | |
| Flight instrument | |
| Type | Xc_tracer_ii |
| Model | Not Set |
| Firmware | Xc_tracer_ii_r04 |
| Height: | |
| Speed: | |
| Climb: | |
| Distance: |
| Main Map: |
| First Tab: |