


| Duration | 0:00 | Takeoff Distance | 0 |
| Height: | metres |
| Climb: | m/sec |
| Speed: | km/h |
| Distance: | km |
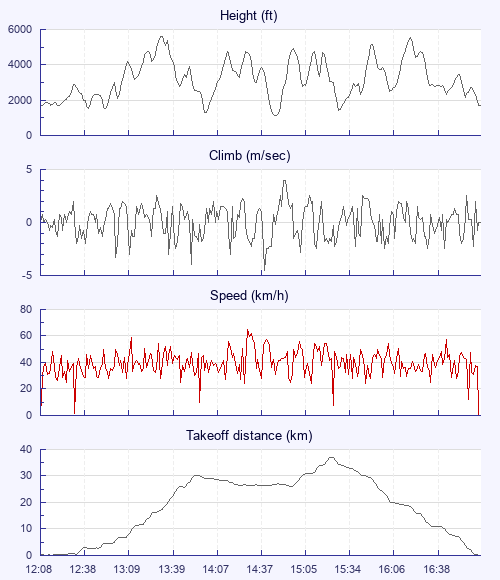
| Height - GPS data | |
| Maximum Height [13:34:10] |
5627 ft |
| Lowest Save [14:51:35] |
1109 ft |
| Takeoff Height [12:08:17] |
1650 ft |
| Landing Height [17:16:19] |
1690 ft |
| Total Ascent | 41965 ft |
| Height Gain | |
| Above Takeoff | 3976 ft |
| Maximum | 4429 ft |
| Low Point as Lowest Save |
1109 ft |
| High Point [16:26:36] |
5538 ft |
| Units | |
| Climb - Pressure data | |
| Maximum Climb [14:56:29] |
4.0 m/s |
| Minimum Climb [14:44:17] |
-4.5 m/s |
| Units | |
| Speed | |
| Maximum Speed [14:33:37] |
64.8 km/h |
| Average Speed around course |
22.3 km/h |
| Average Speed over track length |
39.5 km/h |
| Units | |
| Tracklog | |
| Flight Duration | 5hrs 8mins |
| Track Points | 18477 |
| Recording Interval | 1 secs |
| Statistics Interval | 4 secs |
| Track Length | 202.7 km |
| Invalid Positions [< 1%] |
2 |
| Units | |
| Flight instrument | |
| Type | Oudie 4 |
| Model | Not Set |
| Firmware | 7.21.003 |
| Height: | |
| Speed: | |
| Climb: | |
| Distance: |
| Main Map: |
| First Tab: |