


| Duration | 0:00 | Takeoff Distance | 0 |
| Height: | metres |
| Climb: | m/sec |
| Speed: | km/h |
| Distance: | km |
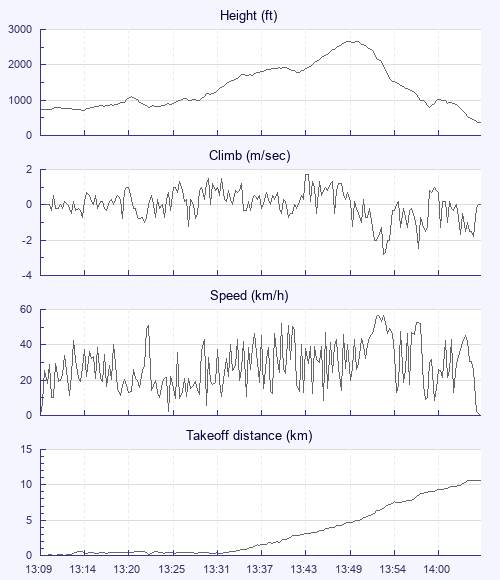
| Height - GPS data | |
| Maximum Height [13:50:11] |
2671 ft |
| Takeoff Height [13:09:49] |
732 ft |
| Landing Height [14:05:39] |
371 ft |
| Total Ascent | 3553 ft |
| Height Gain | |
| Above Takeoff | 1939 ft |
| Maximum | 1965 ft |
| Low Point [13:14:01] |
705 ft |
| High Point as Maximum Height |
2671 ft |
| Units | |
| Climb - Pressure data | |
| Maximum Climb [13:43:29] |
1.7 m/s |
| Minimum Climb [13:53:29] |
-2.8 m/s |
| Units | |
| Speed | |
| Maximum Speed [13:52:59] |
56.4 km/h |
| Average Speed around course |
13.8 km/h |
| Average Speed over track length |
28.8 km/h |
| Units | |
| Tracklog | |
| Flight Duration | 55mins |
| Track Points | 574 |
| Recording Interval | 6 secs |
| Statistics Interval | 6 secs |
| Track Length | 26.8 km |
| Units | |
| Flight instrument | |
| Type | Oudie 4 Basic |
| Model | Not Set |
| Firmware | 7.00.001 |
| Height: | |
| Speed: | |
| Climb: | |
| Distance: |
| Main Map: |
| First Tab: |