


| Duration | 0:00 | Takeoff Distance | 0 |
| Height: | metres |
| Climb: | m/sec |
| Speed: | km/h |
| Distance: | km |
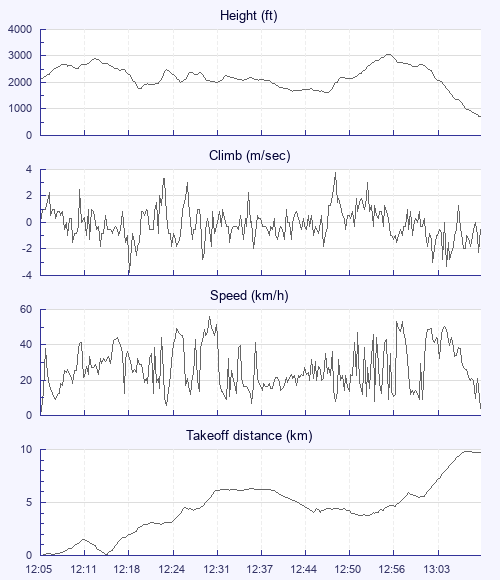
| Height - GPS data | |
| Maximum Height [12:57:27] |
3051 ft |
| Lowest Save [12:48:46] |
1621 ft |
| Takeoff Height [12:05:40] |
2113 ft |
| Landing Height [13:11:05] |
709 ft |
| Total Ascent | 5509 ft |
| Height Gain | |
| Above Takeoff | 938 ft |
| Maximum | 1430 ft |
| Low Point as Lowest Save |
1621 ft |
| High Point as Maximum Height |
3051 ft |
| Units | |
| Climb - Pressure data | |
| Maximum Climb [12:49:52] |
3.8 m/s |
| Minimum Climb [12:18:36] |
-3.8 m/s |
| Units | |
| Speed | |
| Maximum Speed [12:30:44] |
55.8 km/h |
| Average Speed around course |
17.0 km/h |
| Average Speed over track length |
27.0 km/h |
| Units | |
| Tracklog | |
| Flight Duration | 1hr 5mins |
| Track Points | 3926 |
| Recording Interval | 1 secs |
| Statistics Interval | 4 secs |
| Track Length | 29.4 km |
| Units | |
| Height: | |
| Speed: | |
| Climb: | |
| Distance: |
| Main Map: |
| First Tab: |