My first triangle - just blind luck it was long enough to get the 2x multiplier. Amazing convergence line to Appleby and well beyond, only spoilt by the appearance of an RAF Typhoon doing loops… Yes please I'd like a transponder!


| Duration | 0:00 | Takeoff Distance | 0 |
| Height: | metres |
| Climb: | m/sec |
| Speed: | km/h |
| Distance: | km |
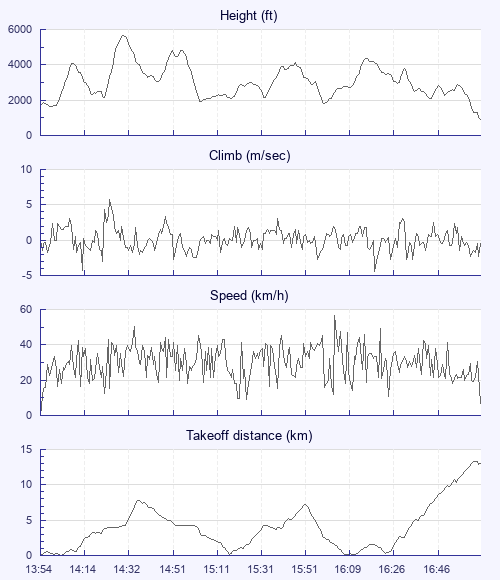
| Height - GPS data | |
| Maximum Height [14:31:28] |
5656 ft |
| Lowest Save [16:01:34] |
1801 ft |
| Takeoff Height [13:54:52] |
1699 ft |
| Landing Height [17:07:15] |
919 ft |
| Total Ascent | 22526 ft |
| Height Gain | |
| Above Takeoff | 3957 ft |
| Maximum | 4049 ft |
| Low Point [13:58:25] |
1608 ft |
| High Point as Maximum Height |
5656 ft |
| Units | |
| Climb - Pressure data | |
| Maximum Climb [14:25:41] |
5.8 m/s |
| Minimum Climb [16:21:50] |
-4.5 m/s |
| Units | |
| Speed | |
| Maximum Speed [16:05:25] |
56.7 km/h |
| Average Speed around course |
10.8 km/h |
| Average Speed over track length |
29.8 km/h |
| Units | |
| Tracklog | |
| Flight Duration | 3hrs 12mins |
| Track Points | 11542 |
| Recording Interval | 1 secs |
| Statistics Interval | 4 secs |
| Track Length | 95.6 km |
| Units | |
| Flight instrument | |
| Type | Xc_tracer_ii |
| Model | Not Set |
| Firmware | Xc_tracer_ii_r05 |
My first triangle - just blind luck it was long enough to get the 2x multiplier. Amazing convergence line to Appleby and well beyond, only spoilt by the appearance of an RAF Typhoon doing loops… Yes please I'd like a transponder!
| Height: | |
| Speed: | |
| Climb: | |
| Distance: |
| Main Map: |
| First Tab: |