


| Duration | 0:00 | Takeoff Distance | 0 |
| Height: | metres |
| Climb: | m/sec |
| Speed: | km/h |
| Distance: | km |
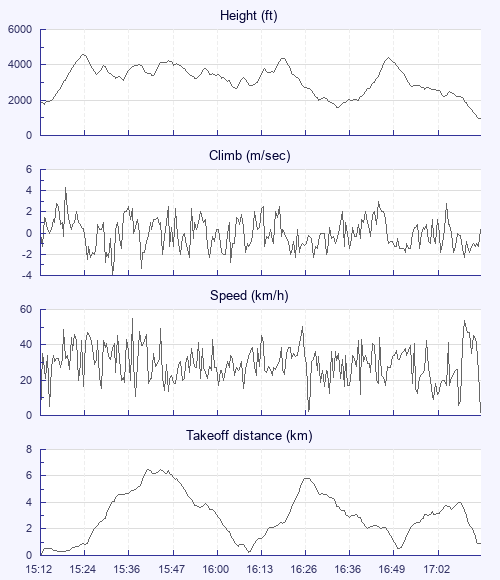
| Height - GPS data | |
| Maximum Height [15:24:01] |
4564 ft |
| Lowest Save [16:35:41] |
1598 ft |
| Takeoff Height [15:12:32] |
1909 ft |
| Landing Height [17:16:16] |
965 ft |
| Total Ascent | 15167 ft |
| Height Gain | |
| Above Takeoff | 2654 ft |
| Maximum | 2861 ft |
| Low Point as Lowest Save |
1598 ft |
| High Point [16:50:21] |
4459 ft |
| Units | |
| Climb - Pressure data | |
| Maximum Climb [15:19:00] |
4.3 m/s |
| Minimum Climb [15:32:12] |
-4.0 m/s |
| Units | |
| Speed | |
| Maximum Speed [15:37:28] |
54.9 km/h |
| Average Speed around course |
14.8 km/h |
| Average Speed over track length |
29.8 km/h |
| Units | |
| Tracklog | |
| Flight Duration | 2hrs 3mins |
| Track Points | 7425 |
| Recording Interval | 1 secs |
| Statistics Interval | 4 secs |
| Track Length | 61.5 km |
| Units | |
| Flight instrument | |
| Type | Flymaster |
| Model | Livesd |
| Firmware | 2.03b |
| Height: | |
| Speed: | |
| Climb: | |
| Distance: |
| Main Map: |
| First Tab: |