


| Duration | 0:00 | Takeoff Distance | 0 |
| Height: | metres |
| Climb: | m/sec |
| Speed: | km/h |
| Distance: | km |
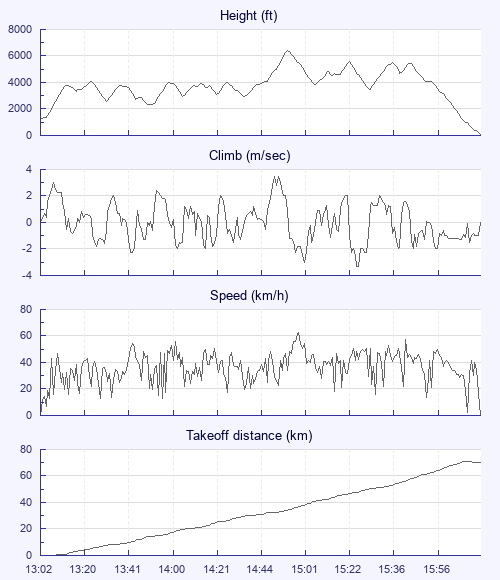
| Height - GPS data | |
| Maximum Height [14:58:15] |
6378 ft |
| Lowest Save [13:51:34] |
2306 ft |
| Takeoff Height [13:02:05] |
1240 ft |
| Landing Height [16:19:37] |
92 ft |
| Total Ascent | 17825 ft |
| Height Gain | |
| Above Takeoff | 5138 ft |
| Units | |
| Climb - GPS data | |
| Maximum Climb [14:54:57] |
3.5 m/s |
| Minimum Climb [15:26:48] |
-3.3 m/s |
| Units | |
| Speed | |
| Maximum Speed [15:01:20] |
63.0 km/h |
| Average Speed around course |
23.1 km/h |
| Average Speed over track length |
35.1 km/h |
| Units | |
| Tracklog | |
| Flight Duration | 3hrs 17mins |
| Track Points | 3565 |
| Recording Interval | 3 secs |
| Statistics Interval | 6 secs |
| Track Length | 115.5 km |
| Units | |
| Flight instrument - reported as | |
| GPSMAP 78s Software Version 6.30 |
| Height: | |
| Speed: | |
| Climb: | |
| Distance: |
| Main Map: |
| First Tab: |