


| Duration | 0:00 | Takeoff Distance | 0 |
| Height: | metres |
| Climb: | m/sec |
| Speed: | km/h |
| Distance: | km |
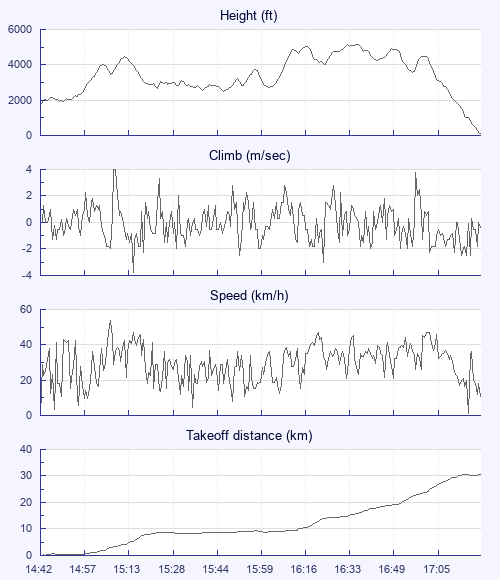
| Height - GPS data | |
| Maximum Height [16:36:57] |
5174 ft |
| Lowest Save [15:47:34] |
2516 ft |
| Takeoff Height [14:42:28] |
1775 ft |
| Landing Height [17:21:33] |
118 ft |
| Total Ascent | 16319 ft |
| Height Gain | |
| Above Takeoff | 3399 ft |
| Units | |
| Climb - Pressure data | |
| Maximum Climb [15:08:12] |
4.0 m/s |
| Minimum Climb [15:14:52] |
-3.8 m/s |
| Units | |
| Speed | |
| Maximum Speed [15:07:40] |
54.0 km/h |
| Average Speed around course |
14.3 km/h |
| Average Speed over track length |
29.5 km/h |
| Units | |
| Tracklog | |
| Flight Duration | 2hrs 39mins |
| Track Points | 9546 |
| Recording Interval | 1 secs |
| Statistics Interval | 4 secs |
| Track Length | 78.3 km |
| Units | |
| Flight instrument | |
| Type | Flymaster |
| Model | Gps+sd |
| Firmware | 2.03b |
| Height: | |
| Speed: | |
| Climb: | |
| Distance: |
| Main Map: |
| First Tab: |