


| Duration | 0:00 | Takeoff Distance | 0 |
| Height: | metres |
| Climb: | m/sec |
| Speed: | km/h |
| Distance: | km |
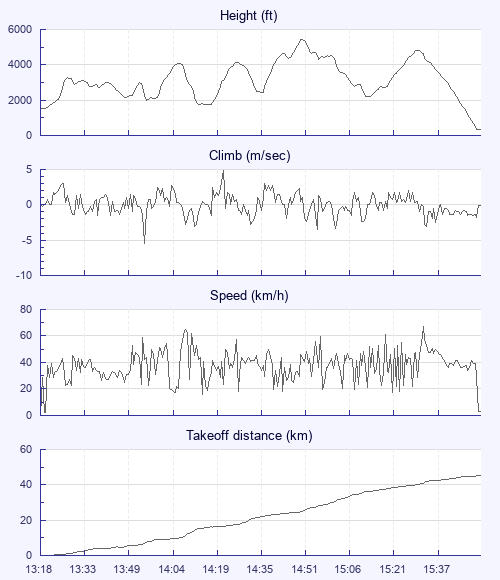
| Height - GPS data | |
| Maximum Height [14:51:50] |
5459 ft |
| Lowest Save [14:15:00] |
1729 ft |
| Takeoff Height [13:18:26] |
1496 ft |
| Landing Height [15:55:11] |
315 ft |
| Total Ascent | 18337 ft |
| Height Gain | |
| Above Takeoff | 3963 ft |
| Maximum | 3970 ft |
| Low Point [13:18:28] |
1490 ft |
| High Point as Maximum Height |
5459 ft |
| Units | |
| Climb - Pressure data | |
| Maximum Climb [14:23:14] |
4.8 m/s |
| Minimum Climb [13:55:46] |
-5.5 m/s |
| Units | |
| Speed | |
| Maximum Speed [15:35:46] |
67.5 km/h |
| Average Speed around course |
21.6 km/h |
| Average Speed over track length |
38.3 km/h |
| Units | |
| Tracklog | |
| Flight Duration | 2hrs 36mins |
| Track Points | 9406 |
| Recording Interval | 1 secs |
| Statistics Interval | 4 secs |
| Track Length | 100.0 km |
| Units | |
| Flight instrument - reported as | |
| Flymaster F1, V1.5, S/N 1728 |
| Height: | |
| Speed: | |
| Climb: | |
| Distance: |
| Main Map: |
| First Tab: |