


| Duration | 0:00 | Takeoff Distance | 0 |
| Height: | metres |
| Climb: | m/sec |
| Speed: | km/h |
| Distance: | km |
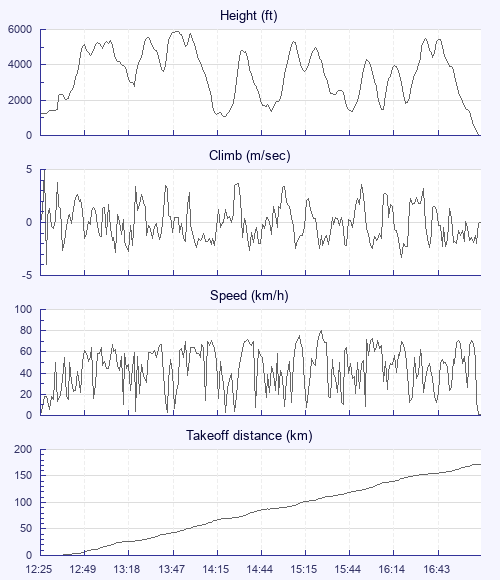
| Height - GPS data | |
| Maximum Height [13:49:34] |
5896 ft |
| Lowest Save [14:20:22] |
1076 ft |
| Takeoff Height [12:25:24] |
1266 ft |
| Landing Height [17:11:47] |
3 ft |
| Total Ascent | 33609 ft |
| Height Gain | |
| Above Takeoff | 4629 ft |
| Maximum | 4636 ft |
| Low Point [12:25:35] |
1260 ft |
| High Point as Maximum Height |
5896 ft |
| Units | |
| Climb - Pressure data | |
| Maximum Climb [12:25:33] |
5.0 m/s |
| Minimum Climb [12:25:38] |
-4.0 m/s |
| Units | |
| Speed | |
| Maximum Speed [15:25:32] |
80.2 km/h |
| Average Speed around course |
38.2 km/h |
| Average Speed over track length |
45.1 km/h |
| Units | |
| Tracklog | |
| Flight Duration | 4hrs 46mins |
| Track Points | 1605 |
| Recording Interval | 11 secs |
| Statistics Interval | 11 secs |
| Track Length | 215.3 km |
| Units | |
| Flight instrument | |
| Type | Flyskyhy |
| Model | 6.13 |
| Firmware | 6.13 |
| Height: | |
| Speed: | |
| Climb: | |
| Distance: |
| Main Map: |
| First Tab: |