Xc Title
User:Guest
Cloudbase Paragliding advert
Lewis Price  All flights
SE Wales League 2019
Flight type image
Turnpoint Flight on a Paraglider
Club
SE Wales
Glider
Advance Sigma 10
Date
21st August 2019
Start
11:37
Finish
14:34
Duration
2hrs 57mins
Takeoff
Milk Hill White Horse
Landing
Sherington
Coords
Takeoff
51.37257, -1.85842
Start
51.37125, -1.85853
TP1
51.51598, -1.71048
TP2
51.55837, -1.58082
TP3
51.56963, -1.58167
Finish
52.11428, -0.70630
Landing
52.11428, -0.70630
Distances and Score
Leg 1
19.11k
Leg 2
10.16k
Leg 3
1.26k
Leg 4
85.51k
Total
116.04k
Score
116.0
Open Distance
Total
114.8k
Filename
Use full pilot name
Download
Validated
Yes
Flight map
Notes

This map gives an overview of the flight, using the turnpoints to plot the track.

Use the for a detailed map and flight track.

Duration 0:00   Takeoff Distance 0
Controls
To animate the flight: click a point on the track, use the slider, or click the Play button.
slider
slider
Speed
Speed
Slower
Faster
Track color
No data
Highlights
Track data
Time: No data
Height:
Climb:
Speed:
Interval:
Units
Height: metres
Climb: m/sec
Speed: km/h
Distance: km
chart
Notes

Climb and Speed averaged over 4 second intervals.

These values may be lower than those shown by a flight instrument, which has access to continuous raw data.

Metric units are used for all chart data, except for Height which is shown in feet.

Height   -   GPS data
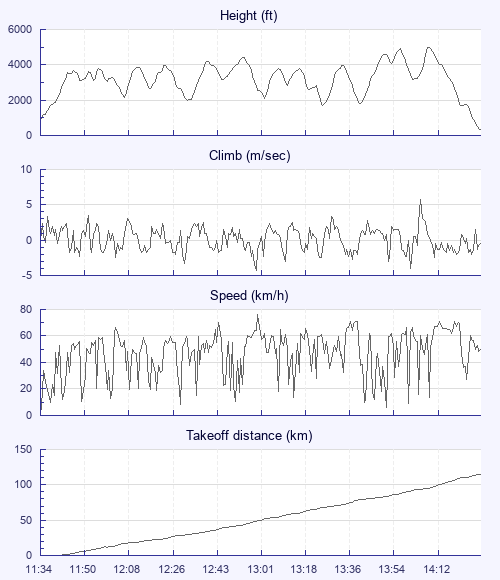
Maximum Height
[14:13:23]
5007 ft
Lowest Save
[13:29:25]
1726 ft
Takeoff Height
[11:34:05]
866 ft
Landing Height
[14:34:33]
367 ft
Total Ascent 24288 ft
Height Gain
Above Takeoff 4140 ft
Units
Climb   -   Pressure data
Maximum Climb
[14:10:37]
5.8 m/s
Minimum Climb
[13:02:05]
-4.3 m/s
Units
Speed
Maximum Speed
[13:02:33]
76.5 km/h
Average Speed
around course
39.3 km/h
Average Speed
over track length
47.0 km/h
Units
Tracklog
Flight Duration 3hrs
Track Points 10829
Recording Interval 1 secs
Statistics Interval 4 secs
Track Length 141.5 km
Units
Flight instrument
Type Xc_tracer_ii
Model Not Set
Firmware Xc_tracer_ii_r09
Notes

Climb and Speed averaged over 4 second intervals.

These values may be lower than those shown by a flight instrument, which has access to continuous raw data.

Average Speed around course is measured from Start to Finish points.

Track Length is the cumulative distance between track points from Takeoff to Landing.

You can change the default units displayed - see the Options page.

Use this page to set various display Options. You can choose which units are used to display flight data, which map to show when the starts and which tab to show each time you view a flight.
Units settings

Metric units are used by default for the Statistics and XC Player pages, except for Height data which is shown in feet. You can choose your own custom settings here.

Height:
Speed:
Climb:
Distance:
  Use default
XC Player settings

When the XC Player starts, the track data is shown on the Hybrid map. You can choose a different map here.

Main Map:
  Use default
Tab settings

The first tab shown when you view a flight is the Flight Map. You can choose a different tab here.

First Tab:
  Use default
Notes

This page uses cookies to save your settings for future visits.

If you have disabled cookies for this site then any changes you make will not be saved.